
Surveys · Nonresponse, weighting and data quality
Adaptive and Responsive Survey Designs for Efficient Knowledge Acquisition
Traditional surveys apply the same fieldwork protocol to every sampled case. Adaptive and responsive designs change the protocol during fieldwork, or tailor it to different groups, using data on response and cost. This article explains how they work and what the evidence shows.
Traditional surveys are designed in advance and carried out as planned. Every sampled person or household receives the same invitation, the same number of reminders or call attempts and the same incentive, and fieldwork continues until the budget or the time runs out. This approach is simple and transparent, but it is not efficient. Some groups respond readily and receive more effort than they need; others respond rarely and would benefit from a different approach. Effort spent late in fieldwork may add interviews without changing the estimates at all.
Adaptive and responsive survey designs address this problem. They use information available before and during fieldwork to change how cases are approached, aiming to improve quality for a given cost or to reduce cost for a given quality (Groves & Heeringa, 2006; Schouten et al., 2017). As response rates have fallen and costs have risen, these designs have moved from experiments into routine practice at several statistical agencies and survey organisations.
Responsive design
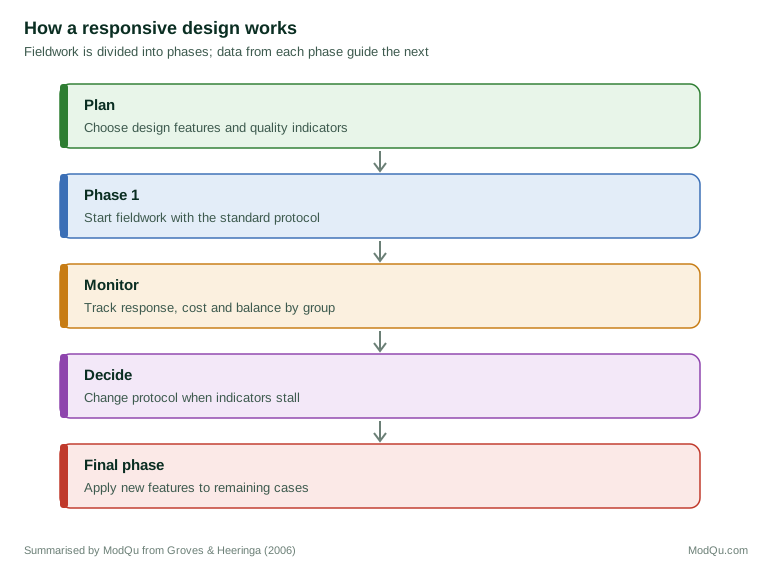
Groves and Heeringa (2006) introduced responsive design for large face-to-face household surveys. Its central idea is that fieldwork can be divided into phases. In each phase, survey managers monitor indicators of cost and quality using paradata, such as call records and interviewer observations. When the indicators show that additional effort under the current protocol is producing little change, the survey moves to a new phase with different design features, such as a larger incentive, a shorter questionnaire or a different mode. Figure 1 shows the sequence.
A common final phase is two-phase sampling for nonresponse: a random subsample of remaining nonrespondents is selected and receives intensive effort, while the rest receive no further contact. Respondents from the subsample are given larger weights. This concentrates expensive effort on fewer cases and can reduce nonresponse bias at lower cost than pursuing every case (Groves & Heeringa, 2006). The idea goes back to Hansen and Hurwitz (1946), who showed how a subsample of nonrespondents to a mailed questionnaire could be interviewed in person to produce unbiased estimates for the whole sample.
Axinn et al. (2011) applied responsive design to demographic surveys and argued that the phases should be planned around the survey's substantive models: effort should be directed to the cases whose absence would most distort the relationships researchers intend to study, not only to those easiest to convert.
Wagner et al. (2012) described the use of responsive design in the National Survey of Family Growth in the United States, where paradata were used daily to direct interviewers' effort towards cases with higher predicted chances of response and towards groups that were under-represented.
Adaptive design
Adaptive survey design places more emphasis on planning in advance. The sample is divided into groups, often using information from the sampling frame or administrative records, and each group receives a different combination of design features chosen to optimise an explicit quality objective within the budget (Schouten et al., 2013, 2017). For example, groups with low expected web response might be offered a telephone or face-to-face follow-up earlier, while groups with high web response receive only mailed reminders.
The terms overlap, and many surveys combine both approaches. Tourangeau et al. (2017) describe adaptive designs as tailoring treatments to subgroups, possibly changing them during fieldwork, and responsive designs as using phases with changes based on accumulating data.
Choosing what to optimise
Both approaches require a measure of quality. The response rate is not sufficient, because a higher response rate does not necessarily reduce bias (Groves & Peytcheva, 2008). Peytchev et al. (2009) showed that additional effort to increase response sometimes left nonresponse bias unchanged, because the additional respondents resembled those already obtained.
Adaptive designs therefore often aim to make response more balanced across groups. The R-indicator measures how much response propensities vary across groups defined by auxiliary variables: if all groups respond at similar rates, the response is more representative of the sample in those variables (Schouten et al., 2009). Other indicators include the variation in subgroup response rates, the fraction of missing information for key estimates (Wagner, 2010) and the change in estimates between phases. A design aims to improve the chosen indicator subject to cost.
What design features can be varied?
Many features can be tailored or changed during fieldwork:
- Mode, such as moving from web to telephone or face-to-face follow-up for groups that respond poorly online.
- Contact strategy, including the number, timing and spacing of calls or reminders. Wagner (2013) showed that tailoring call times using data on prior contact attempts can increase contact rates.
- Incentives, offering larger or different incentives to groups with low response.
- Interviewer assignment, giving difficult cases to more experienced interviewers.
- Questionnaire length, offering a shorter version to reluctant respondents in the final phase.
- Stopping rules, ending effort on cases or groups when further effort is unlikely to improve quality.
What the evidence shows
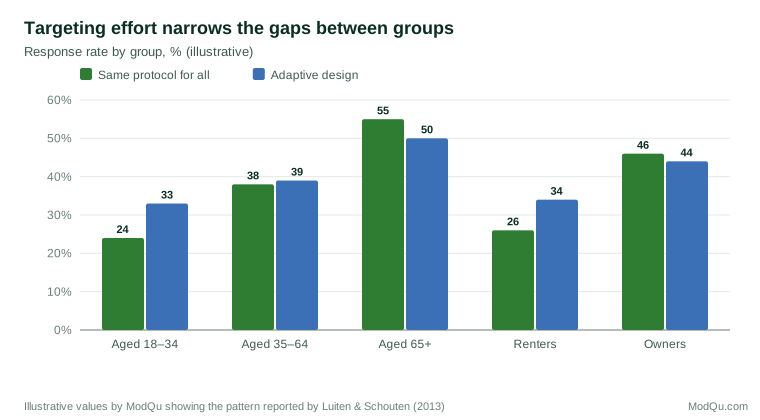
Experiments and applications have produced mixed but generally positive results. Luiten and Schouten (2013) tested a tailored design in a Dutch survey of consumer sentiment, in which call strategies and modes were assigned to groups based on their expected response. Representativeness improved while the response rate and cost stayed similar. Figure 2 illustrates the kind of effect such designs aim for.
Lundquist and Särndal (2013) analysed the Swedish Living Conditions Survey and found that stopping data collection earlier for over-represented groups, and focusing effort on others, could produce more balanced response with little loss in accuracy. Tourangeau et al. (2017), reviewing the literature, concluded that adaptive and responsive designs often reduce costs and can improve balance on auxiliary variables, but that clear evidence of reduced bias in the survey's key estimates is less common. Improving balance on the variables used to guide the design does not guarantee less bias on other variables (Brick & Tourangeau, 2017).
Using paradata to guide decisions
Adaptive and responsive designs depend on information collected during fieldwork. Call records show how many attempts each case has received and with what outcome; interviewer observations describe households that have not yet responded; and response propensity models, updated as fieldwork progresses, predict which cases are likely to respond to further effort (Kreuter, 2013). Survey managers typically view this information on dashboards that show response, cost and balance indicators by group and by day. Schouten et al. (2011) proposed partial R-indicators, which show which groups contribute most to imbalance and therefore where additional effort would most improve representativeness.
The quality of these decisions depends on the quality of the data. Predictions of response based on weak auxiliary variables will direct effort poorly, and interviewer observations contain errors. Decision rules should be tested on past data before they are used, and their effects checked during fieldwork.
Risks and limitations
Adaptive designs bring several risks. If design features differ between groups, measurement may also differ: a group moved to telephone follow-up may answer some questions differently from a group that responded online. Changes in protocol between phases can also complicate comparisons over time in repeated surveys. Differential treatment raises questions of fairness, for example when larger incentives are offered to some groups and not others. Most survey organisations accept such differences when they are justified by the aim of representing all groups, but they should be documented and explained (Singer & Ye, 2013). Finally, adaptive designs add complexity to fieldwork management and weighting, which requires skilled staff and good systems.
Requirements
Adaptive and responsive designs need several conditions:
- Good auxiliary data, from the frame, administrative records or paradata, that are related to both response and the survey's key variables.
- Timely paradata and systems that allow managers to see indicators during fieldwork and to change case treatments quickly.
- Flexible fieldwork operations, including interviewers and contact systems that can apply different protocols to different cases.
- Pre-specified rules for when and how the design will change, so that decisions are not made ad hoc.
- Appropriate weighting, which reflects subsampling and differential treatment.
These requirements are easier to meet for repeated surveys, where past data can be used to predict response and to test design changes, than for one-off studies.
Adaptive designs in commercial research
Many principles of adaptive design are already familiar in commercial research, where quotas, sample boosts for under-represented groups and targeted reminders are routine. The difference is that adaptive designs make these decisions explicit, base them on measured indicators and evaluate their effect on quality as well as on cost. For organisations running tracking studies or customer surveys repeatedly, recording paradata, defining quality indicators and testing alternative protocols on random subsamples are practical first steps.
An example
A national agency runs a quarterly household survey with a web-first design and face-to-face follow-up. Past quarters show that young renters respond poorly online and that older home owners respond well. The agency adopts an adaptive design: young renters receive an earlier interviewer visit and a larger conditional incentive, while older home owners receive mailed reminders only. Halfway through fieldwork, a dashboard shows that response among single-person households is lagging, so remaining cases in that group are prioritised for interviewer visits. Overall response is unchanged, but the R-indicator improves and fieldwork costs fall by about a tenth (illustrative example).
Conclusion
Adaptive and responsive designs replace a single fixed protocol with one that uses information about the sample and about fieldwork as it progresses. By directing effort where it does most good and stopping it where it does little, they can make surveys more efficient and their responses more balanced. They do not remove the need for weighting or guarantee unbiased estimates, and they depend on good auxiliary data and flexible operations. Used carefully, they make each unit of fieldwork effort contribute more to the knowledge a survey produces.
References
Axinn, W. G., Link, C. F., & Groves, R. M. (2011). Responsive survey design, demographic data collection, and models of demographic behavior. Demography, 48(3), 1127–1149. https://doi.org/10.1007/s13524-011-0044-1
Brick, J. M., & Tourangeau, R. (2017). Responsive survey designs for reducing nonresponse bias. Journal of Official Statistics, 33(3), 735–752. https://doi.org/10.1515/jos-2017-0034
Groves, R. M., & Heeringa, S. G. (2006). Responsive design for household surveys: Tools for actively controlling survey errors and costs. Journal of the Royal Statistical Society: Series A, 169(3), 439–457. https://doi.org/10.1111/j.1467-985X.2006.00423.x
Groves, R. M., & Peytcheva, E. (2008). The impact of nonresponse rates on nonresponse bias: A meta-analysis. Public Opinion Quarterly, 72(2), 167–189. https://doi.org/10.1093/poq/nfn011
Hansen, M. H., & Hurwitz, W. N. (1946). The problem of non-response in sample surveys. Journal of the American Statistical Association, 41(236), 517–529. https://doi.org/10.1080/01621459.1946.10501894
Kreuter, F. (Ed.). (2013). Improving surveys with paradata: Analytic uses of process information. Wiley. https://doi.org/10.1002/9781118596869
Luiten, A., & Schouten, B. (2013). Tailored fieldwork design to increase representative household survey response: An experiment in the Survey of Consumer Satisfaction. Journal of the Royal Statistical Society: Series A, 176(1), 169–189. https://doi.org/10.1111/j.1467-985X.2012.01080.x
Lundquist, P., & Särndal, C.-E. (2013). Aspects of responsive design with applications to the Swedish Living Conditions Survey. Journal of Official Statistics, 29(4), 557–582. https://doi.org/10.2478/jos-2013-0040
Peytchev, A., Baxter, R. K., & Carley-Baxter, L. R. (2009). Not all survey effort is equal: Reduction of nonresponse bias and nonresponse error. Public Opinion Quarterly, 73(4), 785–806. https://doi.org/10.1093/poq/nfp037
Schouten, B., Calinescu, M., & Luiten, A. (2013). Optimizing quality of response through adaptive survey designs. Survey Methodology, 39(1), 29–58.
Schouten, B., Cobben, F., & Bethlehem, J. (2009). Indicators for the representativeness of survey response. Survey Methodology, 35(1), 101–113.
Schouten, B., Peytchev, A., & Wagner, J. (2017). Adaptive survey design. CRC Press. https://doi.org/10.1201/9781315153964
Schouten, B., Shlomo, N., & Skinner, C. (2011). Indicators for monitoring and improving representativeness of response. Journal of Official Statistics, 27(2), 231–253.
Singer, E., & Ye, C. (2013). The use and effects of incentives in surveys. The Annals of the American Academy of Political and Social Science, 645(1), 112–141. https://doi.org/10.1177/0002716212458082
Tourangeau, R., Brick, J. M., Lohr, S., & Li, J. (2017). Adaptive and responsive survey designs: A review and assessment. Journal of the Royal Statistical Society: Series A, 180(1), 203–223. https://doi.org/10.1111/rssa.12186
Wagner, J. (2010). The fraction of missing information as a tool for monitoring the quality of survey data. Public Opinion Quarterly, 74(2), 223–243. https://doi.org/10.1093/poq/nfq007
Wagner, J. (2013). Adaptive contact strategies in telephone and face-to-face surveys. Survey Research Methods, 7(1), 45–55. https://doi.org/10.18148/srm/2013.v7i1.5037
Wagner, J., West, B. T., Kirgis, N., Lepkowski, J. M., Axinn, W. G., & Ndiaye, S. K. (2012). Use of paradata in a responsive design framework to manage a field data collection. Journal of Official Statistics, 28(4), 477–499.