
Statistics · Foundations
What Statistics Is and Why It Matters for Decision-Making
What statistics is, how it turns data into evidence under uncertainty, and why sound statistical thinking leads to better business and survey decisions than intuition or raw data alone.
Every organisation makes decisions with incomplete information. A retailer must decide how much stock to order before it knows next month's demand. A bank must set credit limits before it knows which customers will repay. A brand team must choose a campaign before it knows how the market will respond. Statistics is the discipline that helps people make such decisions well: it is the science of collecting, describing and interpreting data so that conclusions can be drawn, and actions taken, while being honest about uncertainty.
This article explains what statistics is, how it differs from simply having data, and why it matters for anyone who uses surveys, market research or business data to make choices.
A working definition
Statistics is often confused with mathematics, but the two are not the same. Mathematics deals with abstract structures that are true by proof. Statistics deals with real measurements that are messy, incomplete and variable. Cobb and Moore (1997) put the difference simply: in statistics, data are not just numbers, they are numbers with a context. A figure of 42% means nothing until we know 42% of whom, measured how, and compared with what.
Tukey (1962) argued that the heart of the subject is data analysis: looking at data to learn what they say, not only applying formal theory. Modern accounts describe statistics as a way of thinking as much as a set of techniques. Wild and Pfannkuch (1999) identify the core elements of this statistical thinking: recognising the need for data, transforming problems into measurable quantities, considering variation, reasoning with models, and integrating the statistical results with knowledge of the subject matter.
In practice, the field has two broad branches:
- Descriptive statistics summarise what the data show: averages, percentages, spreads and charts.
- Inferential statistics use a sample to draw conclusions about a larger population, or about the future, and attach a measure of uncertainty to those conclusions.
Most business decisions need both. A dashboard that reports last quarter's sales is descriptive. A forecast of next quarter's sales, with a range of plausible values, is inferential.
Why data alone are not enough
It is tempting to believe that more data automatically means better decisions. It does not. Data are produced by a process, such as a survey, a sales system or a website log, and every process has gaps and distortions. Statistics provides the tools to understand those distortions and to separate real signals from noise.
Three ideas sit at the centre of this work.
Variation. Measurements differ from one person, store or week to the next. Some of that variation reflects real differences, and some is chance. Deming (1975) stressed that the purpose of statistical work in business is to provide a rational basis for action, and that managers who react to every random fluctuation as if it were meaningful will make worse decisions, not better ones.
Uncertainty. Because we rarely observe a whole population, our estimates are uncertain. Statistics quantifies that uncertainty with tools such as standard errors and confidence intervals, so that a decision-maker knows not only the best estimate but also how far it could plausibly be from the truth.
Bias. An estimate can be precise and still wrong if the data come from the wrong people or are measured in a distorted way. Sampling theory, developed in the twentieth century and set out in standard texts such as Lohr (2021), shows how properly designed random samples make it possible to estimate population values with known accuracy.
A worked example: when more data do not help
Suppose a hypothetical company wants to know what share of its customers would pay for a premium service. It has two options. It can survey a random sample of customers, or it can count responses to an open invitation on its website, which attracts many more people but only those who chose to reply.
The quality of an estimate depends on two kinds of error. Sampling error comes from chance and shrinks as the sample grows. Bias comes from the way the data were collected and does not shrink with sample size. A common way to combine them is the root mean squared error:
Error = √(bias² + SE²), where SE = √(p(1 − p) ÷ n)
Here p is the true proportion and n is the number of respondents. In an illustrative case where the true share is 50% and the website sample over-represents keen customers by 4 percentage points, the random sample of 100 has a typical error of 5.0 points, falling to 1.6 points at 1,000 respondents. The self-selected sample of 100 has an error of 6.4 points, but even at 100,000 respondents its error never falls below 4 points.
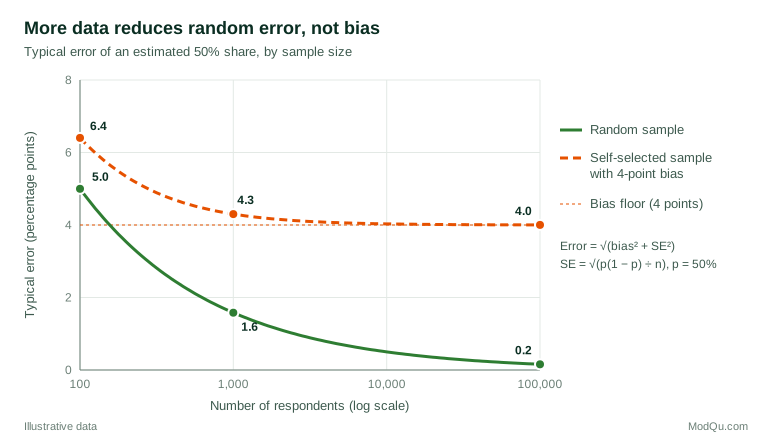
The lesson is that a carefully designed sample of a thousand people can be more trustworthy than a careless one of a hundred thousand. Meng (2018) showed formally that, for large non-random datasets, even a tiny correlation between who is included and what is being measured can wipe out the apparent advantage of size. The AAPOR task force on non-probability sampling reached a similar practical conclusion: such samples can be useful, but their accuracy depends on modelling assumptions that must be stated and checked (Baker et al., 2013).
How statistics supports decisions
Statistics contributes to decision-making in at least four ways.
1. Framing the right question
Good statistical work begins before any data are collected. Wild and Pfannkuch (1999) describe an investigative cycle that runs from problem to plan, data, analysis and conclusions. Turning a vague concern ("customers seem unhappy") into a measurable question ("what share of last year's customers rate us 7 or higher, and has that changed?") is itself a statistical skill.
2. Designing data collection
How data are gathered determines what they can show. Random sampling supports generalisation to a population, and randomised experiments support conclusions about cause and effect. Online businesses now run controlled experiments at large scale to test product changes, and Kohavi et al. (2020) describe how careful design and analysis of these A/B tests prevent costly false conclusions. Holland (1986) explains why causal claims require a comparison of what happened with what would have happened otherwise, something observational data alone rarely provide.
3. Quantifying uncertainty and risk
A decision based on a single number hides risk. Reporting an interval, for example "between 38% and 46% of customers would upgrade", tells the decision-maker how much confidence the evidence supports. The American Statistical Association has warned that a p-value, on its own, does not measure the size or importance of an effect, and that business or policy decisions should not rest on whether a p-value passes a threshold (Wasserstein & Lazar, 2016).
4. Correcting for human judgement
People are not natural statisticians. Tversky and Kahneman (1974) documented systematic errors in intuitive judgement, such as overweighting vivid examples and ignoring base rates. Gigerenzer et al. (2007) showed that even trained professionals often misread risk statistics, and that presenting information as natural frequencies ("8 out of 1,000") rather than conditional probabilities greatly improves understanding. Statistics offers a discipline that counteracts these tendencies.
Statistics, models and the real world
Statistical conclusions almost always rely on models: simplified descriptions of how the data were generated. Box (1976) warned that scientists should not fall in love with their models, and that the value of a model lies in being useful rather than perfectly true. A demand model, a customer-segmentation model or a survey weighting scheme is a tool, and its assumptions must be checked against reality.
Statistics also sits within a larger research process. Moore (1998) argued that statistics is a fundamental method of reasoning in its own right, valuable well beyond the technical specialist. Kass et al. (2016) offer practical rules for effective statistical practice, among them: begin with a clear question, recognise that signals always come with noise, plan ahead, worry about data quality, and make the analysis reproducible.
Practical guidance for survey and business data
- Start with the decision. Ask what action the data will inform, and what result would change that action, before choosing a method.
- Know where the data came from. Check who was sampled, who responded and who was missing. High response rates do not guarantee low bias, and low response rates do not guarantee high bias; what matters is whether non-respondents differ on the variables of interest (Groves, 2006).
- Report uncertainty alongside every estimate. Show margins of error or intervals, especially when comparing groups or time periods.
- Separate exploration from confirmation. Patterns found by searching many cuts of the data need to be confirmed on new data before they drive major decisions.
- Use context. Compare results with benchmarks, past waves or external sources, and involve people who understand the market.
Common mistakes
- Equating volume with accuracy. As Figure 1 shows, a large biased dataset can be worse than a small random one.
- Treating correlation as causation. Two measures that move together may share a common cause. Controlled comparisons are needed before claiming that one drives the other (Holland, 1986).
- Chasing statistical significance. Testing many hypotheses and reporting only the "significant" ones produces false discoveries. Simmons et al. (2011) showed how undisclosed flexibility in data collection and analysis can make almost any result appear significant, and Ioannidis (2005) argued that many published findings are likely to be false for related reasons.
- Ignoring practical importance. A difference can be statistically detectable and still too small to matter commercially.
- Over-trusting a single study. Decisions are stronger when several independent sources point the same way.
Key takeaways
Statistics is the science of learning from data in the presence of variation and uncertainty. It matters for decision-making because it turns raw numbers into evidence, shows how much confidence that evidence deserves, and guards against the predictable errors of intuition. For survey and business data, the most important lessons are simple: be clear about the question, understand how the data were produced, report uncertainty honestly, and remember that a well-designed small study often beats a poorly designed large one.
References
Baker, R., Brick, J. M., Bates, N. A., Battaglia, M., Couper, M. P., Dever, J. A., Gile, K. J., & Tourangeau, R. (2013). Summary report of the AAPOR task force on non-probability sampling. Journal of Survey Statistics and Methodology, 1(2), 90–143. https://doi.org/10.1093/jssam/smt008
Box, G. E. P. (1976). Science and statistics. Journal of the American Statistical Association, 71(356), 791–799. https://doi.org/10.1080/01621459.1976.10480949
Cobb, G. W., & Moore, D. S. (1997). Mathematics, statistics, and teaching. The American Mathematical Monthly, 104(9), 801–823. https://doi.org/10.1080/00029890.1997.11990723
Deming, W. E. (1975). On probability as a basis for action. The American Statistician, 29(4), 146–152. https://doi.org/10.1080/00031305.1975.10477402
Gigerenzer, G., Gaissmaier, W., Kurz-Milcke, E., Schwartz, L. M., & Woloshin, S. (2007). Helping doctors and patients make sense of health statistics. Psychological Science in the Public Interest, 8(2), 53–96. https://doi.org/10.1111/j.1539-6053.2008.00033.x
Groves, R. M. (2006). Nonresponse rates and nonresponse bias in household surveys. Public Opinion Quarterly, 70(5), 646–675. https://doi.org/10.1093/poq/nfl033
Holland, P. W. (1986). Statistics and causal inference. Journal of the American Statistical Association, 81(396), 945–960. https://doi.org/10.1080/01621459.1986.10478354
Ioannidis, J. P. A. (2005). Why most published research findings are false. PLoS Medicine, 2(8), Article e124. https://doi.org/10.1371/journal.pmed.0020124
Kass, R. E., Caffo, B. S., Davidian, M., Meng, X.-L., Yu, B., & Reid, N. (2016). Ten simple rules for effective statistical practice. PLoS Computational Biology, 12(6), Article e1004961. https://doi.org/10.1371/journal.pcbi.1004961
Kohavi, R., Tang, D., & Xu, Y. (2020). Trustworthy online controlled experiments: A practical guide to A/B testing. Cambridge University Press. https://doi.org/10.1017/9781108653985
Lohr, S. L. (2021). Sampling: Design and analysis (3rd ed.). Chapman and Hall/CRC. https://doi.org/10.1201/9780429298899
Meng, X.-L. (2018). Statistical paradises and paradoxes in big data (I): Law of large populations, big data paradox, and the 2016 US presidential election. The Annals of Applied Statistics, 12(2), 685–726. https://doi.org/10.1214/18-AOAS1161SF
Moore, D. S. (1998). Statistics among the liberal arts. Journal of the American Statistical Association, 93(444), 1253–1259. https://doi.org/10.1080/01621459.1998.10473786
Simmons, J. P., Nelson, L. D., & Simonsohn, U. (2011). False-positive psychology: Undisclosed flexibility in data collection and analysis allows presenting anything as significant. Psychological Science, 22(11), 1359–1366. https://doi.org/10.1177/0956797611417632
Tukey, J. W. (1962). The future of data analysis. The Annals of Mathematical Statistics, 33(1), 1–67. https://doi.org/10.1214/aoms/1177704711
Tversky, A., & Kahneman, D. (1974). Judgment under uncertainty: Heuristics and biases. Science, 185(4157), 1124–1131. https://doi.org/10.1126/science.185.4157.1124
Wasserstein, R. L., & Lazar, N. A. (2016). The ASA statement on p-values: Context, process, and purpose. The American Statistician, 70(2), 129–133. https://doi.org/10.1080/00031305.2016.1154108
Wild, C. J., & Pfannkuch, M. (1999). Statistical thinking in empirical enquiry. International Statistical Review, 67(3), 223–248. https://doi.org/10.1111/j.1751-5823.1999.tb00442.x