
Statistics · Foundations
A Short History of Statistics: From Political Arithmetic to Data Science
How statistics grew from counting births and deaths for the state into a science of uncertainty, and why that history still shapes how surveys and business data are analysed today.
Statistics is sometimes taught as a fixed toolkit of formulas, but every tool in that kit was invented to solve a particular problem at a particular time. Knowing where the methods came from helps analysts understand what they assume, why rival schools of thought still disagree, and why modern data science is less of a break with the past than it may appear. This article traces the main stages of that history, from seventeenth-century "political arithmetic" to the computing-intensive methods of today, and draws out the lessons for survey research and business analysis.
Political arithmetic: counting for the state
The story usually begins in London in 1662, when the merchant John Graunt published his Natural and Political Observations on the city's weekly Bills of Mortality. By tabulating christenings and burials, Graunt estimated the population of London, noticed that slightly more boys than girls were born year after year, and drew up a rough table of survival by age. His friend William Petty called this kind of work "political arithmetic": the use of numbers to describe the population, trade and wealth of a nation for the purposes of government (Hald, 1990).
The word "statistics" itself arrived later and carried a similar meaning. In eighteenth-century German universities, Statistik was the descriptive study of the state, often with few numbers at all. Only in the early nineteenth century did the term come to mean, above all, numerical facts about society (Hacking, 1990). The link between statistics and official data collection, which survives today in national statistical offices and censuses, is therefore part of the discipline's origin rather than a later application.
Probability and the theory of errors
A second, quite separate stream came from mathematics. Probability theory grew out of questions about games of chance in the seventeenth century and was soon applied to annuities, insurance and the reliability of testimony (Hald, 1990). In 1763 the Royal Society published, after his death, an essay by the clergyman Thomas Bayes on how to reason backwards from observed events to the probability that produced them (Bayes, 1763). This "inverse probability" is the ancestor of today's Bayesian statistics.
Astronomers and surveyors faced a practical version of the same problem: how to combine many slightly conflicting measurements into a single best estimate. The method of least squares, published by Legendre in 1805 and justified on probabilistic grounds by Gauss in 1809, became the standard answer, and with it the normal curve became the standard model of measurement error (Fienberg, 1992). Least squares remains the engine of linear regression.
The avalanche of numbers
From the 1820s onward, European states and voluntary societies began to collect and print statistics on an unprecedented scale: crime, suicide, disease, literacy and trade. Hacking (1990) calls this an "avalanche of printed numbers". The Belgian astronomer Adolphe Quetelet brought the two streams together, applying the error curve of astronomy to human characteristics such as height and chest size. His concept of the "average man" suggested that social phenomena, although individually unpredictable, showed stable regularities in the aggregate. That idea, that chance can be tamed by counting enough cases, underpins every sample survey.
The birth of mathematical statistics
The decades around 1900 turned statistics into a mathematical discipline with its own journals and university departments. Francis Galton, studying the heights of parents and their adult children, observed that the children of unusually tall or short parents tended to be closer to the average. He called this "regression towards mediocrity" (Galton, 1886), and the name stuck to the whole family of regression methods. Galton's work also led to the correlation coefficient.
Karl Pearson and his colleagues in London built the mathematical apparatus. Pearson's (1900) chi-square criterion gave, for the first time, a general way to judge whether observed frequencies departed from expected ones by more than chance would allow, the test still applied to survey cross-tabulations every day. In 1908 William Sealy Gosset, a chemist at the Guinness brewery writing under the pen name "Student", worked out the distribution of the mean in small samples, giving us the t test (Student, 1908). His problem was a business one: making reliable decisions about barley and beer from a handful of measurements.
Ronald Fisher then laid out much of the logic that modern statistics still uses. His 1922 paper defined the aims of estimation, introduced the ideas of consistency, efficiency and sufficiency, and set out the method of maximum likelihood (Fisher, 1922). Working at an agricultural research station, Fisher also developed the analysis of variance and the principles of randomised experiments. Jerzy Neyman and Egon Pearson reframed testing as a decision between two hypotheses with controlled error rates, introducing the now-familiar Type I and Type II errors and statistical power (Neyman & Pearson, 1933). The tension between Fisher's evidential p-values and the Neyman–Pearson decision framework was never fully resolved, and much of today's confusion about significance testing comes from teaching an uneasy blend of the two.
Sampling and the modern survey
For market and social researchers, one paper of this period matters above all. Before the 1930s, many official inquiries relied on "purposive selection": choosing districts or respondents judged to be typical. Neyman (1934) showed that random selection within strata gave estimates whose accuracy could be calculated, while purposive selection could not guarantee this, and in the same paper he introduced confidence intervals. Probability sampling became the foundation of the sample survey.
Groves (2011) describes what followed as three eras of survey research. From about 1930 to 1960, the basic tools of sampling, questionnaire design and estimation were invented. From about 1960 to 1990, surveys expanded rapidly with telephone interviewing, computers and large commercial and government programmes. Since about 1990, falling response rates and the rise of administrative, transactional and online data have pushed researchers to combine designed surveys with "organic" data that were never collected for research.
Computing and the rise of data science
Even at the height of mathematical statistics, some voices argued that the field was becoming too theoretical. Tukey (1962) urged statisticians to treat data analysis as an empirical science in its own right, valuing exploration, graphics and robust methods over elegant proofs. Cheap computing made his vision practical. Efron's (1979) bootstrap replaced difficult formulas with repeated resampling of the data, allowing standard errors and confidence intervals for almost any statistic.
Breiman (2001) described "two cultures" in statistical modelling: one that assumes a stochastic model generated the data and seeks to estimate it, and one that treats the data-generating mechanism as unknown and judges algorithms by their predictive accuracy. Machine learning grew mainly from the second culture. Donoho (2017), writing fifty years after Tukey's call, argued that what is now marketed as data science largely fulfils the programme Tukey had set out, with computing, data preparation and prediction placed at its centre. Efron and Hastie (2016) show how inference itself has been reshaped by computation, while still resting on the ideas of Fisher, Neyman and Bayes.
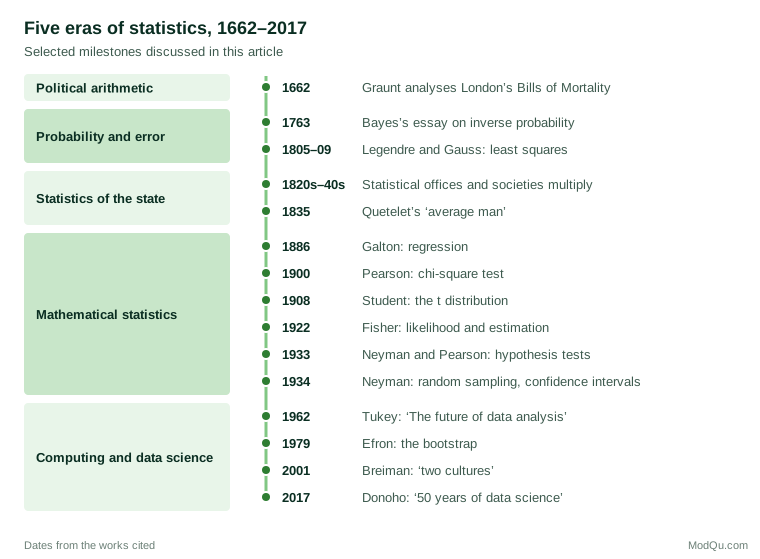
Fienberg (1992) notes that historians tell this story in several ways, emphasising mathematics, social measurement or scientific practice. The timeline in Figure 1 is therefore one useful simplification, not a complete account.
Why the history matters for business data
- Methods carry their original assumptions. The t test was built for small, carefully measured samples; regression for continuous measurements with random error. Using them on large, messy or self-selected data requires care.
- Probability sampling is the reason a survey can generalise. Neyman's argument still applies: margins of error are meaningful only when the selection mechanism is known or can be modelled. Online and opt-in samples need weighting and modelling to stand in for that missing design.
- Testing debates are old debates. Arguments about p-values, significance thresholds and Bayesian alternatives repeat disagreements among Fisher, Neyman and the followers of Bayes. Reporting effect sizes and intervals, not only "significant or not", avoids the worst of the confusion.
- Prediction and explanation are different goals. Breiman's two cultures remain a useful check. A churn model that predicts well may say little about why customers leave, and a well-specified explanatory model may predict poorly.
- Official statistics remain the benchmark. From Graunt's Bills of Mortality to today's census, population counts provide the totals against which surveys are weighted and validated.
Key takeaways
Statistics grew from two roots: counting people and resources for the state, and the mathematics of probability and measurement error. Between 1885 and 1935 these roots fused into mathematical statistics, giving us regression, the chi-square and t tests, maximum likelihood, hypothesis testing and probability sampling. Computing then shifted attention to exploration, resampling and prediction, the core of data science. For anyone working with survey or business data, this history explains why the standard tools work, when they do not, and why sound design still matters as much as clever analysis.
References
Bayes, T. (1763). An essay towards solving a problem in the doctrine of chances. Philosophical Transactions of the Royal Society of London, 53, 370–418. https://doi.org/10.1098/rstl.1763.0053
Breiman, L. (2001). Statistical modeling: The two cultures (with comments and a rejoinder by the author). Statistical Science, 16(3), 199–231. https://doi.org/10.1214/ss/1009213726
Donoho, D. (2017). 50 years of data science. Journal of Computational and Graphical Statistics, 26(4), 745–766. https://doi.org/10.1080/10618600.2017.1384734
Efron, B. (1979). Bootstrap methods: Another look at the jackknife. The Annals of Statistics, 7(1), 1–26. https://doi.org/10.1214/aos/1176344552
Efron, B., & Hastie, T. (2016). Computer age statistical inference: Algorithms, evidence, and data science. Cambridge University Press. https://doi.org/10.1017/CBO9781316576533
Fienberg, S. E. (1992). A brief history of statistics in three and one-half chapters: A review essay. Statistical Science, 7(2), 208–225. https://doi.org/10.1214/ss/1177011360
Fisher, R. A. (1922). On the mathematical foundations of theoretical statistics. Philosophical Transactions of the Royal Society of London. Series A, 222(594–604), 309–368. https://doi.org/10.1098/rsta.1922.0009
Galton, F. (1886). Regression towards mediocrity in hereditary stature. The Journal of the Anthropological Institute of Great Britain and Ireland, 15, 246–263. https://doi.org/10.2307/2841583
Groves, R. M. (2011). Three eras of survey research. Public Opinion Quarterly, 75(5), 861–871. https://doi.org/10.1093/poq/nfr057
Hacking, I. (1990). The taming of chance. Cambridge University Press. https://doi.org/10.1017/CBO9780511819766
Hald, A. (1990). A history of probability and statistics and their applications before 1750. Wiley. https://doi.org/10.1002/0471725161
Neyman, J. (1934). On the two different aspects of the representative method: The method of stratified sampling and the method of purposive selection. Journal of the Royal Statistical Society, 97(4), 558–625. https://doi.org/10.2307/2342192
Neyman, J., & Pearson, E. S. (1933). IX. On the problem of the most efficient tests of statistical hypotheses. Philosophical Transactions of the Royal Society of London. Series A, 231(694–706), 289–337. https://doi.org/10.1098/rsta.1933.0009
Pearson, K. (1900). X. On the criterion that a given system of deviations from the probable in the case of a correlated system of variables is such that it can be reasonably supposed to have arisen from random sampling. The London, Edinburgh, and Dublin Philosophical Magazine and Journal of Science, 50(302), 157–175. https://doi.org/10.1080/14786440009463897
Student. (1908). The probable error of a mean. Biometrika, 6(1), 1–25. https://doi.org/10.1093/biomet/6.1.1
Tukey, J. W. (1962). The future of data analysis. The Annals of Mathematical Statistics, 33(1), 1–67. https://doi.org/10.1214/aoms/1177704711