
Statistics · Data science and machine learning
Synthetic Minority Oversampling and Imbalanced Data Knowledge
What class imbalance does to predictive models, how SMOTE creates synthetic minority cases, and why calibration, sensible thresholds and honest validation often matter more than rebalancing.
Many of the outcomes businesses most want to predict are rare. Perhaps 4% of subscribers cancel in a given month, 1% of transactions are fraudulent, and only a small share of survey respondents say they will switch supplier. Data sets of this kind are called imbalanced: one class, the minority, is far smaller than the other. Imbalance creates real difficulties for classification models, and a large toolkit has grown up to deal with it (He & Garcia, 2009). The best known tool is SMOTE, the Synthetic Minority Over-sampling Technique (Chawla et al., 2002). This article explains what SMOTE does, when it helps, and why a growing body of evidence suggests that for probability models it is often the wrong fix.
Why imbalance causes problems
A classifier trained to maximise accuracy on a data set with 4% churners can reach 96% accuracy by predicting that nobody churns. Such a model is useless for retention work, yet its headline accuracy looks excellent. Many learning algorithms, particularly decision trees and other methods that optimise overall error, are pulled towards the majority class in this way.
Imbalance alone is not the whole story. In a systematic study, Japkowicz and Stephen (2002) found that the damage depended on the complexity of the boundary between classes and on the absolute size of the training set: with a simple boundary or plenty of data, even severe imbalance did little harm. The underlying problem is often too few minority cases to describe their region of the data, not the ratio itself. A sample of 50,000 customers with 2,000 churners is imbalanced but rich; a sample of 500 with 20 churners is both imbalanced and thin.
It also matters what the model is for. If the aim is a well-calibrated probability of churn for each customer, the class ratio is simply part of reality and a good model should reproduce it. If the aim is to rank or flag customers, the real question is where to draw the line, and that is a decision about costs, not about the training data.
How SMOTE works
The simplest rebalancing methods are random undersampling, which discards majority cases, and random oversampling, which duplicates minority cases. Undersampling throws information away; oversampling by duplication can make a flexible model memorise the few minority cases, a form of overfitting.
Chawla et al. (2002) proposed creating new, synthetic minority cases instead of copies. For each minority case x, SMOTE finds its k nearest neighbours among the other minority cases (the original paper used k = 5), picks one neighbour xnn at random and places a new case at a random point on the line between them:
xnew = x + u × (xnn − x), where u is drawn uniformly between 0 and 1
Repeating this fills in the minority region of the predictor space rather than piling up identical points. Chawla et al. (2002) reported that combining SMOTE with undersampling of the majority class gave better results in ROC space than undersampling alone on several benchmark data sets.
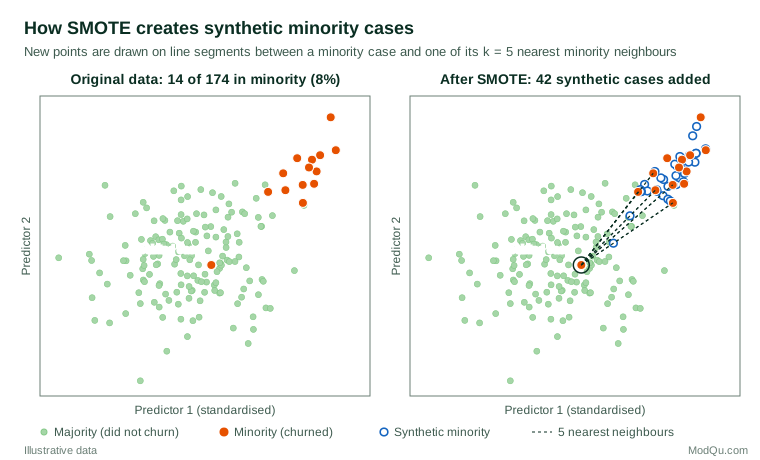
Figure 1 also shows SMOTE's main geometric weakness. It looks only at minority neighbours, so a minority case that sits among majority cases, whether a genuine unusual customer or a coding error, generates synthetic points across the majority region. This blurs the class boundary and can increase false positives.
Variants
Many refinements followed; Fernández et al. (2018) reviewed dozens of them on the method's fifteenth anniversary. Three ideas recur:
- Focus on the boundary. Borderline-SMOTE creates synthetic cases only from minority cases near the class boundary, where errors are most likely (Han et al., 2005).
- Adapt to difficulty. ADASYN generates more synthetic cases for minority cases that are harder to learn, judged by how many majority cases surround them (He et al., 2008).
- Clean up afterwards. Batista et al. (2004) combined SMOTE with cleaning methods such as Tomek links and edited nearest neighbours, which remove overlapping cases. They also found that plain random oversampling was often surprisingly competitive with more elaborate methods.
SMOTE has particular trouble with many predictors. Blagus and Lusa (2013) showed that in high-dimensional data it offered little benefit for most classifiers, because nearest neighbours become less meaningful as dimensions grow. It is also awkward with categorical predictors, which cannot be interpolated; adapted versions exist, but survey data dominated by categorical items deserve caution.
When SMOTE can help
SMOTE is most useful when three conditions hold together: the classifier is flexible and sensitive to class frequencies (decision trees, nearest-neighbour methods, some neural networks), the output that matters is a hard yes/no label rather than a probability, and the minority class forms reasonably compact regions in a modest number of continuous predictors. Fraud screening on transaction amounts and timings, or defect detection from sensor readings, can fit this description. Even then, the benefit should be demonstrated on untouched test data against simpler baselines, such as class weights or a lower threshold, rather than assumed (He & Garcia, 2009; Fernández et al., 2018).
The calibration problem
Rebalancing changes the class ratio that the model learns. A model trained on data with 50% churners will, by design, predict churn probabilities that are far too high for a population in which only 4% churn. Van den Goorbergh et al. (2022) examined this directly for logistic regression. In their simulations and a case study, random undersampling, random oversampling and SMOTE all produced strongly miscalibrated models that overestimated risk, and none improved the area under the ROC curve compared with no correction. They concluded that imbalance correction can do more harm than good when the goal is risk prediction.
A hypothetical example shows the same pattern. We simulated a customer file in which 5% of 5,000 customers churn, fitted a logistic regression to the original data and to a SMOTE-balanced version, and evaluated both on 50,000 new customers with a churn rate of about 4.5%.
| Hypothetical model | AUC | Mean predicted risk | Brier score | Recall | Precision |
|---|---|---|---|---|---|
| Original data, threshold 0.5 | 0.78 | 4.9% | 0.040 | 2% | 54% |
| SMOTE-balanced data, threshold 0.5 | 0.78 | 37.4% | 0.183 | 69% | 11% |
| Original data, threshold 0.05 | 0.78 | 4.9% | 0.040 | 71% | 10% |
Rebalancing did not improve the model's ability to rank customers (the AUC is unchanged). It made the probabilities useless as probabilities: the average predicted risk rose to 37% against a true rate under 5%, and the Brier score (Brier, 1950), which rewards accurate probabilities, became more than four times worse. The apparent gain in recall came entirely from the default 0.5 threshold landing in a different place. Simply lowering the threshold on the original model to 0.05 gave the same recall and precision while keeping probabilities that can be trusted. In other words, SMOTE here acted as an expensive and indirect way of moving the threshold.
If a rebalanced model must be used, its probabilities can be corrected. When the training prevalence π* differs from the population prevalence π, multiplying the model's odds by [π ÷ (1 − π)] ÷ [π* ÷ (1 − π*)] restores the population scale. This is the "prior correction" King and Zeng (2001) described for logistic regression on samples that select cases by outcome; for SMOTE it is an approximation, so calibration should be checked on untouched data.
Evaluating models on imbalanced data
Choice of metric often matters more than choice of resampling method.
- Avoid raw accuracy. It rewards ignoring the minority class.
- Use ROC and precision–recall curves together. The ROC curve is insensitive to changes in class distribution (Fawcett, 2006), which makes it a stable measure of ranking ability but can hide poor performance on the rare class. Saito and Rehmsmeier (2015) showed that precision–recall plots are more informative than ROC plots on imbalanced data, and Davis and Goadrich (2006) showed that a curve dominates in ROC space if and only if it dominates in precision–recall space.
- Check calibration. Plot observed against predicted rates in groups, and report the Brier score. Van Calster et al. (2019) called calibration the Achilles heel of predictive analytics because it is so often ignored.
- Choose thresholds from costs. The best cut-off depends on the cost of contacting a customer who would have stayed against the value of keeping one who would have left. Set it from those costs on the probability scale, not by rebalancing.
Validation pitfalls
The most damaging mistake is resampling before splitting the data. If SMOTE is applied to the full file and the result is then divided into training and test sets, or into cross-validation folds, synthetic cases derived from test-set customers leak into training. Santos et al. (2018) showed that this produces overoptimistic performance estimates. Resampling, like any data-dependent step, must happen inside each training fold only, and the test data must keep their natural class balance (Hastie et al., 2009). Stratified folds, which keep the same share of minority cases in every fold, also help: with only a few dozen churners, an unlucky random split can leave a fold with almost none, making its error estimate meaningless.
Practical guidance for survey and business data
- Ask first whether you need probabilities. For targeting budgets, forecasting churn volumes or feeding expected values into decisions, keep the natural class ratio and fit a well-specified model such as logistic regression (Hosmer et al., 2013).
- Gather more minority cases if possible. Oversampling likely churners or switchers at the design stage, with known selection probabilities and design weights, adds real information; synthetic cases add none.
- Try simple alternatives before SMOTE. Class weights in the loss function, a cost-based threshold and penalized models often achieve the same ranking performance with fewer side effects (He & Garcia, 2009).
- If you use SMOTE, use it with flexible classifiers that struggle with imbalance, tune k, apply it within folds only, recalibrate the outputs and inspect isolated minority cases before generating from them.
- Never weight or report synthetic cases as respondents. They are a training device, not data about people.
Key takeaways
Class imbalance is common in business prediction, and SMOTE is a clever way to give classifiers more minority examples by interpolating between real ones. But imbalance is often less of a problem than it seems: what usually matters is having enough minority cases, choosing sensible metrics and setting thresholds from real costs. When the goal is accurate probabilities, rebalancing tends to distort them without improving discrimination (van den Goorbergh et al., 2022). Use SMOTE selectively, keep it inside the validation loop, and always check calibration on data with the true class balance.
References
Batista, G. E. A. P. A., Prati, R. C., & Monard, M. C. (2004). A study of the behavior of several methods for balancing machine learning training data. ACM SIGKDD Explorations Newsletter, 6(1), 20–29. https://doi.org/10.1145/1007730.1007735
Blagus, R., & Lusa, L. (2013). SMOTE for high-dimensional class-imbalanced data. BMC Bioinformatics, 14(1), Article 106. https://doi.org/10.1186/1471-2105-14-106
Brier, G. W. (1950). Verification of forecasts expressed in terms of probability. Monthly Weather Review, 78(1), 1–3. https://doi.org/10.1175/1520-0493(1950)078<0001:VOFEIT>2.0.CO;2
Chawla, N. V., Bowyer, K. W., Hall, L. O., & Kegelmeyer, W. P. (2002). SMOTE: Synthetic minority over-sampling technique. Journal of Artificial Intelligence Research, 16, 321–357. https://doi.org/10.1613/jair.953
Davis, J., & Goadrich, M. (2006). The relationship between precision-recall and ROC curves. In Proceedings of the 23rd International Conference on Machine Learning (pp. 233–240). Association for Computing Machinery. https://doi.org/10.1145/1143844.1143874
Fawcett, T. (2006). An introduction to ROC analysis. Pattern Recognition Letters, 27(8), 861–874. https://doi.org/10.1016/j.patrec.2005.10.010
Fernández, A., García, S., Herrera, F., & Chawla, N. V. (2018). SMOTE for learning from imbalanced data: Progress and challenges, marking the 15-year anniversary. Journal of Artificial Intelligence Research, 61, 863–905. https://doi.org/10.1613/jair.1.11192
Han, H., Wang, W.-Y., & Mao, B.-H. (2005). Borderline-SMOTE: A new over-sampling method in imbalanced data sets learning. In D.-S. Huang, X.-P. Zhang, & G.-B. Huang (Eds.), Advances in intelligent computing (pp. 878–887). Springer. https://doi.org/10.1007/11538059_91
Hastie, T., Tibshirani, R., & Friedman, J. (2009). The elements of statistical learning: Data mining, inference, and prediction (2nd ed.). Springer. https://doi.org/10.1007/978-0-387-84858-7
He, H., Bai, Y., Garcia, E. A., & Li, S. (2008). ADASYN: Adaptive synthetic sampling approach for imbalanced learning. In 2008 IEEE International Joint Conference on Neural Networks (pp. 1322–1328). IEEE. https://doi.org/10.1109/IJCNN.2008.4633969
He, H., & Garcia, E. A. (2009). Learning from imbalanced data. IEEE Transactions on Knowledge and Data Engineering, 21(9), 1263–1284. https://doi.org/10.1109/TKDE.2008.239
Hosmer, D. W., Jr., Lemeshow, S., & Sturdivant, R. X. (2013). Applied logistic regression (3rd ed.). Wiley. https://doi.org/10.1002/9781118548387
Japkowicz, N., & Stephen, S. (2002). The class imbalance problem: A systematic study. Intelligent Data Analysis, 6(5), 429–449. https://doi.org/10.3233/IDA-2002-6504
King, G., & Zeng, L. (2001). Logistic regression in rare events data. Political Analysis, 9(2), 137–163. https://doi.org/10.1093/oxfordjournals.pan.a004868
Saito, T., & Rehmsmeier, M. (2015). The precision-recall plot is more informative than the ROC plot when evaluating binary classifiers on imbalanced datasets. PLOS ONE, 10(3), Article e0118432. https://doi.org/10.1371/journal.pone.0118432
Santos, M. S., Soares, J. P., Abreu, P. H., Araújo, H., & Santos, J. (2018). Cross-validation for imbalanced datasets: Avoiding overoptimistic and overfitting approaches. IEEE Computational Intelligence Magazine, 13(4), 59–76. https://doi.org/10.1109/MCI.2018.2866730
Van Calster, B., McLernon, D. J., van Smeden, M., Wynants, L., & Steyerberg, E. W. (2019). Calibration: The Achilles heel of predictive analytics. BMC Medicine, 17, Article 230. https://doi.org/10.1186/s12916-019-1466-7
van den Goorbergh, R., van Smeden, M., Timmerman, D., & Van Calster, B. (2022). The harm of class imbalance corrections for risk prediction models: Illustration and simulation using logistic regression. Journal of the American Medical Informatics Association, 29(9), 1525–1534. https://doi.org/10.1093/jamia/ocac093