
Statistics · Inference
P-Values: What They Mean and What They Do Not
What a p-value actually measures, the most common ways it is misread in business and survey reports, and how to report test results so that decision-makers are not misled.
The p-value is the most widely reported number in applied statistics and one of the most misunderstood. Concerned by its misuse, the American Statistical Association issued its first formal statement on a statistical method, setting out what p-values can and cannot tell us (Wasserstein & Lazar, 2016).
What a p-value is
A p-value is the probability, calculated assuming the null hypothesis and every other assumption of the statistical model are true, of obtaining a result at least as extreme as the one observed. In short, it measures how surprising the data would be if there were no real effect.
In a hypothetical packaging test, purchase intention is 44.5% for a new pack and 40.0% for the current one, with 1,000 respondents per group. The test statistic is z = 2.04 and the two-sided p-value is 0.042. The correct reading is: if the two packs truly performed the same, a difference of 4.5 points or more in either direction would occur in about 4% of samples this size. Small p-values signal that the data fit poorly with the null model.
What a p-value is not
Greenland et al. (2016) list more than twenty common misinterpretations, and Goodman (2008) describes a "dirty dozen". The most damaging in business reporting are these.
- It is not the probability that the null hypothesis is true. A p-value of 0.042 does not mean there is a 4.2% chance the packs perform the same. The p-value is calculated assuming the null is true, so it cannot also be the probability of that assumption.
- It is not the probability that the result is a fluke or that a decision based on it is wrong. That depends on how plausible the effect was beforehand and on the power of the study. Sellke et al. (2001) show that, with even prior odds, a p-value of 0.05 corresponds to at least about a 29% probability that the null is true.
- It does not measure the size or importance of an effect. A tiny difference becomes highly significant in a large enough sample, and an important one can be non-significant in a small sample.
- A p-value above 0.05 does not show that there is no effect. It shows only that the data are compatible with no effect, and often with sizeable effects too.
- The difference between "significant" and "not significant" is not itself significant. If the new pack is significant among women (p = 0.03) but not among men (p = 0.20), that does not show the effect differs by gender. A direct test of the difference is needed (Gelman & Stern, 2006).
Why p-values behave as they do
When the null hypothesis is true, every p-value between 0 and 1 is equally likely. A p-value below 0.05 then occurs in 5% of studies purely by chance, which is exactly the Type I error rate. When there is a real effect, small p-values become more common, but how much more depends on power.
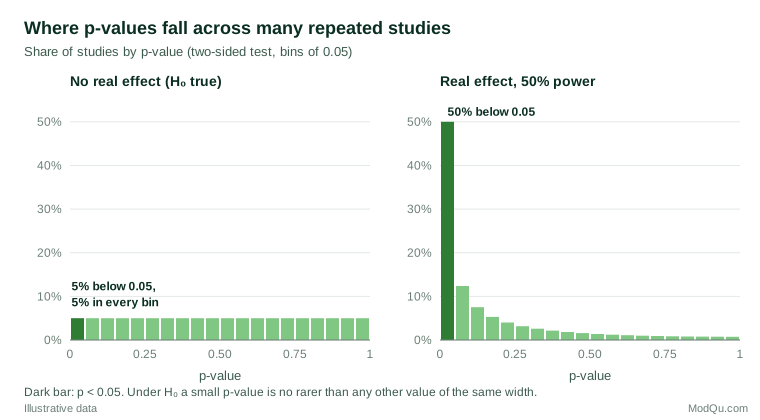
Figure 1 shows that even with a genuine effect, half of the studies at 50% power would miss significance, and repeating a study can easily turn p = 0.03 into p = 0.30. A single p-value is a noisy summary of evidence.
Practical guidance for reporting
- Report the effect size and its confidence interval first, with the exact p-value alongside: "a 4.5-point lift (95% CI 0.2 to 8.8 points), p = 0.042", not "significant at 5%".
- Avoid bright-line thinking. Treat 0.049 and 0.051 as practically the same evidence. Wasserstein et al. (2019) recommend dropping the phrase "statistically significant" altogether.
- Disclose every test that was run, including subgroups and outcomes that did not "work". Selective reporting makes p-values meaningless.
- Combine statistics with judgement: prior evidence, data quality, study design and the cost of acting or not acting.
Key takeaways
A p-value tells you how compatible the data are with a specific null model, nothing more. It is not the probability that a hypothesis is true, not a measure of effect size and not proof of no effect when it is large. Read alongside effect sizes, confidence intervals and context, it is a useful check on sampling noise; read alone, it misleads.
References
Gelman, A., & Stern, H. S. (2006). The difference between "significant" and "not significant" is not itself statistically significant. The American Statistician, 60(4), 328–331. https://doi.org/10.1198/000313006X152649
Goodman, S. N. (2008). A dirty dozen: Twelve p-value misconceptions. Seminars in Hematology, 45(3), 135–140. https://doi.org/10.1053/j.seminhematol.2008.04.003
Greenland, S., Senn, S. J., Rothman, K. J., Carlin, J. B., Poole, C., Goodman, S. N., & Altman, D. G. (2016). Statistical tests, P values, confidence intervals, and power: A guide to misinterpretations. European Journal of Epidemiology, 31(4), 337–350. https://doi.org/10.1007/s10654-016-0149-3
Sellke, T., Bayarri, M. J., & Berger, J. O. (2001). Calibration of p values for testing precise null hypotheses. The American Statistician, 55(1), 62–71. https://doi.org/10.1198/000313001300339950
Wasserstein, R. L., & Lazar, N. A. (2016). The ASA statement on p-values: Context, process, and purpose. The American Statistician, 70(2), 129–133. https://doi.org/10.1080/00031305.2016.1154108
Wasserstein, R. L., Schirm, A. L., & Lazar, N. A. (2019). Moving to a world beyond "p < 0.05". The American Statistician, 73(sup1), 1–19. https://doi.org/10.1080/00031305.2019.1583913