
Statistics · Inference
Type I and Type II Errors and Statistical Power
Every significance test can go wrong in two ways. This article explains false positives, false negatives and statistical power, and shows why underpowered surveys and tests mislead decision-makers.
A significance test turns data into a yes/no decision: either the evidence is strong enough to reject the null hypothesis of "no effect", or it is not. Because the decision rests on a sample, it can be wrong. Jerzy Neyman and Egon Pearson formalised this idea by naming the two possible mistakes and showing how to balance them (Neyman & Pearson, 1933). Their framework still underpins A/B tests and survey comparisons today.
Two ways to be wrong
The four possible outcomes of a test are easiest to see in a table.
| No real effect (H₀ true) | Real effect (H₀ false) | |
|---|---|---|
| Test is significant | Type I error (false positive), probability α | Correct detection, probability 1 − β (power) |
| Test is not significant | Correct non-detection, probability 1 − α | Type II error (false negative), probability β |
A Type I error is declaring an effect that does not exist, such as concluding that a new packaging design lifts purchase intent when the difference in the sample was only chance. Its probability, α, is the significance level the analyst chooses, conventionally 5%.
A Type II error is missing an effect that does exist, such as concluding that a price change made no difference to churn when it actually did. Its probability is written β. Statistical power is 1 − β: the probability that a study detects an effect of a given size if that effect is real.
How power arises
Figure 1 shows the logic. If there is no effect, the test statistic follows the left-hand curve, and the small tails beyond the critical values (±1.96 for a two-sided test at α = 5%) are the Type I error rate. If there is a real effect, the statistic follows the right-hand curve. The part of that curve that falls short of the critical value is β; the part beyond it is power.
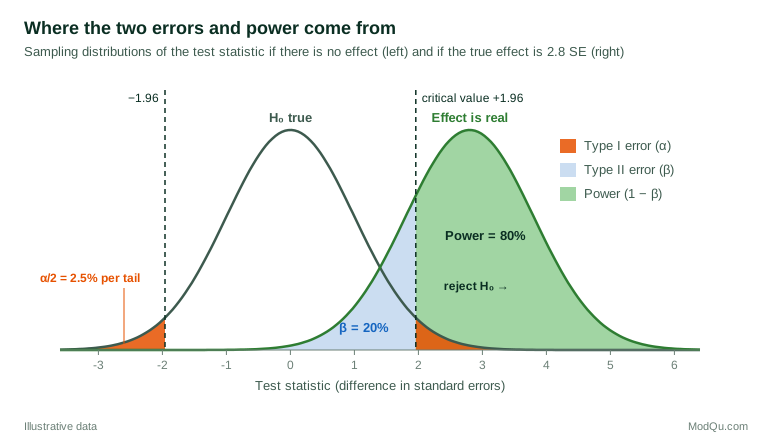
Power depends on four things:
- Effect size. Larger true effects move the right-hand curve further away and are easier to detect.
- Sample size. A larger sample shrinks the standard error, so the same effect sits more standard errors away from zero.
- Significance level. A stricter α (say 1%) pushes the critical value outwards, cutting Type I errors but raising β.
- Variability and design. Noisy measures, clustering and heavy weighting all inflate the standard error and lower power.
For a fixed sample, the two error rates trade off; reducing both requires more, or better, information.
A worked example
Suppose a hypothetical retailer runs an A/B test of two checkout pages. The current page converts 10% of visitors, and the team hopes the new page reaches 12%. With 1,000 visitors per version and a two-sided test at α = 5%, the power to detect that two-point lift is only about 30%. In other words, even if the new page really is better, seven times in ten the test will come back "not significant". To reach the common target of 80% power, the test needs roughly 3,840 visitors per version.
A non-significant result from the smaller test therefore says very little. It is not evidence that the new page makes no difference; it is mostly evidence that the test was too small to tell.
Why low power is costly
Cohen (1962) found that the typical study in a major psychology journal had less than an even chance of detecting a medium-sized effect, and a follow-up review a quarter of a century later found little improvement (Sedlmeier & Gigerenzer, 1989). Button et al. (2013) reported median power of about 21% across neuroscience meta-analyses.
Underpowered studies cause three problems. First, real effects are often missed. Second, a significant result from a small study is less likely to reflect a true effect, because false positives make up a larger share of all significant findings (Ioannidis, 2005). Third, effects that do reach significance in small studies tend to be exaggerated, and can even have the wrong sign; Gelman and Carlin (2014) call these Type M (magnitude) and Type S (sign) errors. A pilot that "won" with a small sample usually disappoints at rollout.
Common mistakes
- Reading non-significance as "no effect". Absence of evidence is not evidence of absence. Report the confidence interval, which shows which effect sizes remain plausible.
- Inflating Type I errors through flexibility. Testing many segments, outcomes or stopping points raises the chance of at least one false positive well above 5% (Simmons et al., 2011). Pre-specify the main comparison or adjust for multiple comparisons, for example with the false discovery rate (Benjamini & Hochberg, 1995).
- Treating α = 5% as a law. The right balance depends on the relative costs of the two errors.
- Equating a p-value with the probability that the null is true. A p-value describes the data under the null hypothesis, not the probability of the hypothesis itself (Wasserstein & Lazar, 2016).
Key takeaways
Every test balances two risks: a false positive (Type I error, α) and a false negative (Type II error, β). Power, 1 − β, is the chance of detecting a real effect of a stated size, and it rises with effect size, sample size and measurement quality. Plan studies with adequate power, typically 80% or more for the smallest effect that matters to the business (Cohen, 1988), and interpret small, non-significant results with caution.
References
Benjamini, Y., & Hochberg, Y. (1995). Controlling the false discovery rate: A practical and powerful approach to multiple testing. Journal of the Royal Statistical Society Series B: Statistical Methodology, 57(1), 289–300. https://doi.org/10.1111/j.2517-6161.1995.tb02031.x
Button, K. S., Ioannidis, J. P. A., Mokrysz, C., Nosek, B. A., Flint, J., Robinson, E. S. J., & Munafò, M. R. (2013). Power failure: Why small sample size undermines the reliability of neuroscience. Nature Reviews Neuroscience, 14(5), 365–376. https://doi.org/10.1038/nrn3475
Cohen, J. (1962). The statistical power of abnormal-social psychological research: A review. The Journal of Abnormal and Social Psychology, 65(3), 145–153. https://doi.org/10.1037/h0045186
Cohen, J. (1988). Statistical power analysis for the behavioral sciences (2nd ed.). Routledge. https://doi.org/10.4324/9780203771587
Gelman, A., & Carlin, J. (2014). Beyond power calculations: Assessing Type S (sign) and Type M (magnitude) errors. Perspectives on Psychological Science, 9(6), 641–651. https://doi.org/10.1177/1745691614551642
Ioannidis, J. P. A. (2005). Why most published research findings are false. PLoS Medicine, 2(8), Article e124. https://doi.org/10.1371/journal.pmed.0020124
Neyman, J., & Pearson, E. S. (1933). On the problem of the most efficient tests of statistical hypotheses. Philosophical Transactions of the Royal Society of London. Series A, Containing Papers of a Mathematical or Physical Character, 231(694–706), 289–337. https://doi.org/10.1098/rsta.1933.0009
Sedlmeier, P., & Gigerenzer, G. (1989). Do studies of statistical power have an effect on the power of studies? Psychological Bulletin, 105(2), 309–316. https://doi.org/10.1037/0033-2909.105.2.309
Simmons, J. P., Nelson, L. D., & Simonsohn, U. (2011). False-positive psychology: Undisclosed flexibility in data collection and analysis allows presenting anything as significant. Psychological Science, 22(11), 1359–1366. https://doi.org/10.1177/0956797611417632
Wasserstein, R. L., & Lazar, N. A. (2016). The ASA statement on p-values: Context, process, and purpose. The American Statistician, 70(2), 129–133. https://doi.org/10.1080/00031305.2016.1154108