
Statistics · Descriptive statistics
Index Numbers and Composite Indicators
How price and quantity index numbers summarise change over time, how composite indicators combine many measures into one score, and how choices of formula, weights and aggregation shape the results.
Many of the numbers that steer business and public decisions are not direct measurements at all. The consumer price index, a brand health score, a customer experience index and a national competitiveness ranking each compress many separate figures into a single number. Two related families of tools do this work. Index numbers summarise how a set of prices or quantities has changed relative to a reference point. Composite indicators combine several different measures, often on different scales, into one score for comparing units such as countries, regions, stores or brands. Both depend on choices that are easy to overlook.
Simple index numbers
The simplest index expresses a value in one period as a percentage of its value in a chosen base period:
It = 100 × xt ÷ x0
If an average order value rises from $40 in the base year to $46 this year, the index is 115, meaning a 15% rise. Indexing removes units, so different series can share one chart. Choose a normal base period; an unusually weak base month makes every later figure look strong.
Weighted price indices
Real price indices cover many items, and the items matter to different degrees. The classic solution is to price a fixed basket of goods. The two oldest formulas differ only in which basket they use (Balk, 2008):
Laspeyres: PL = 100 × Σ ptq0 ÷ Σ p0q0
Paasche: PP = 100 × Σ ptqt ÷ Σ p0qt
Here p is price, q is quantity, 0 is the base period and t the current period. The Laspeyres index asks what the base-period basket would cost today; the Paasche index asks what today's basket would have cost in the base period. The Fisher index is the geometric mean of the two, √(PL × PP). Diewert (1976) showed that the Fisher index and a few similar formulas are "superlative": they closely approximate a true cost-of-living index while allowing buyers to substitute between goods.
A worked example
Consider a hypothetical three-item basket. In quarter 0, a household buys 100 units of item A at $4.00, 150 of item B at $2.00 and 60 of item C at $5.00, a total of $1,000. By quarter 4, prices are $6.00, $2.20 and $5.40, and because item A has become much dearer the household now buys 70 of A, 190 of B and 62 of C.
- The quarter 0 basket at quarter 4 prices costs $1,254, so the Laspeyres index is 125.4.
- The quarter 4 basket costs $1,172.80 at current prices and $970 at base prices, so the Paasche index is 1,172.8 ÷ 970 × 100 = 120.9.
- The Fisher index is √(125.4 × 120.9) = 123.1.
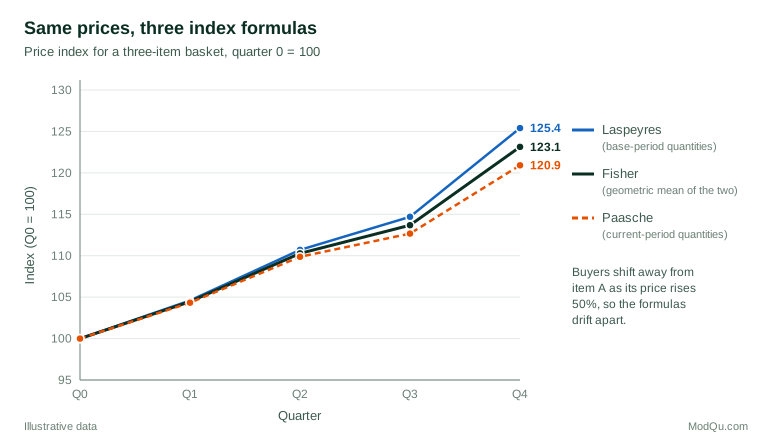
The four-point gap is substitution bias. Laspeyres ignores the fact that buyers moved away from item A, so it tends to overstate the rise in living costs; Paasche tends to understate it. A review of the United States consumer price index estimated its overall upward bias, from substitution, new products, quality change and outlet shifts, at about 1.1 percentage points a year (Boskin et al., 1998), which prompted many methodological changes (Diewert, 1998).
Chaining and rebasing
Over long periods, a fixed basket becomes outdated. Statistical agencies therefore chain indices, updating weights regularly and linking period-to-period changes together. Chaining reduces substitution bias but can introduce chain drift when prices and quantities bounce around, as with frequent promotions: a chained index may fail to return to its starting value even when prices and quantities return to their original levels. Ivancic et al. (2011) showed that this drift can be severe with high-frequency supermarket scanner data, a warning for any business building a price tracker from transaction records.
Composite indicators
A composite indicator combines several sub-indicators into a single score. Examples include well-being indices, innovation scoreboards and, in market research, brand equity or customer experience indices built from survey items such as awareness, satisfaction and likelihood to recommend. The Handbook on Constructing Composite Indicators sets out a widely used sequence of steps (Organisation for Economic Co-operation and Development [OECD] et al., 2008):
- Define the concept and a theoretical framework.
- Select indicators that measure it, and check their quality.
- Treat missing values and outliers.
- Normalise the indicators to a common scale.
- Weight the indicators.
- Aggregate them into one score.
- Test robustness, and report the results with their components visible.
Normalisation
Indicators measured on different scales must be made comparable. Common methods include min–max rescaling to 0–100, z-scores (subtract the mean, divide by the standard deviation) and ranking. Min–max scores are easy to explain but sensitive to extreme values. The choice can change the final ranking even when the data are identical.
Weighting and aggregation
Weights may come from expert judgement, stakeholder consultation, statistical methods such as principal components, or simple equality. None is neutral (Decancq & Lugo, 2013). A common misunderstanding is that a weight equals an indicator's importance in the final score. In practice, an indicator's influence also depends on its variance and its correlation with the other indicators, so nominal weights and actual importance can differ substantially (Becker et al., 2017; Paruolo et al., 2013).
Aggregation determines how far a strength in one area can make up for a weakness in another. Arithmetic (additive) aggregation is fully compensatory: a brand with excellent awareness and poor satisfaction can score the same as one with average levels of both. Geometric aggregation penalises imbalance, and non-compensatory methods go further (Greco et al., 2019). The right choice depends on whether the concept being measured allows such trade-offs.
Robustness
Because each step involves a judgement, a composite score carries uncertainty beyond sampling error. Uncertainty and sensitivity analysis re-computes the index under alternative normalisations, weights and aggregation rules and shows how much each unit's score or rank moves (Saisana et al., 2005). If a unit ranks fifth under one reasonable set of choices and fifteenth under another, its rank is not a precise fact.
Practical guidance for survey and business data
- State the base period and the formula. "Up 12%" means little without knowing the reference point and whether weights are fixed or chained.
- Use weights that reflect spending or importance. For an internal price tracker, weight items by revenue share rather than treating every product equally.
- Keep the components visible. Report the sub-indicators alongside a composite score so that users can see what drives a change.
- Check correlations before weighting. Highly correlated survey items can double-count one idea.
- Run a sensitivity check. Even a simple comparison of equal versus alternative weights shows whether conclusions are robust.
Common mistakes
- Comparing index levels across different bases. An index of 120 on a 2015 base and 110 on a 2020 base cannot be compared directly without rebasing.
- Treating a composite as a measurement. A composite indicator is a model of a concept, not an observation of it, and it can be shaped to support a desired message (Saltelli, 2007).
Key takeaways
Index numbers and composite indicators turn many figures into one, which makes them powerful for communication and monitoring. Their results depend on the base period, the formula, the normalisation, the weights and the aggregation rule. Good practice is to make each of these choices explicit, prefer superlative or chained price indices when quantities shift, show the components of any composite score and test how sensitive the conclusions are to reasonable alternatives.
References
Balk, B. M. (2008). Price and quantity index numbers: Models for measuring aggregate change and difference. Cambridge University Press. https://doi.org/10.1017/CBO9780511720758
Becker, W., Saisana, M., Paruolo, P., & Vandecasteele, I. (2017). Weights and importance in composite indicators: Closing the gap. Ecological Indicators, 80, 12–22. https://doi.org/10.1016/j.ecolind.2017.03.056
Boskin, M. J., Dulberger, E. R., Gordon, R. J., Griliches, Z., & Jorgenson, D. W. (1998). Consumer prices, the consumer price index, and the cost of living. Journal of Economic Perspectives, 12(1), 3–26. https://doi.org/10.1257/jep.12.1.3
Decancq, K., & Lugo, M. A. (2013). Weights in multidimensional indices of wellbeing: An overview. Econometric Reviews, 32(1), 7–34. https://doi.org/10.1080/07474938.2012.690641
Diewert, W. E. (1976). Exact and superlative index numbers. Journal of Econometrics, 4(2), 115–145. https://doi.org/10.1016/0304-4076(76)90009-9
Diewert, W. E. (1998). Index number issues in the consumer price index. Journal of Economic Perspectives, 12(1), 47–58. https://doi.org/10.1257/jep.12.1.47
Greco, S., Ishizaka, A., Tasiou, M., & Torrisi, G. (2019). On the methodological framework of composite indices: A review of the issues of weighting, aggregation, and robustness. Social Indicators Research, 141(1), 61–94. https://doi.org/10.1007/s11205-017-1832-9
Ivancic, L., Diewert, W. E., & Fox, K. J. (2011). Scanner data, time aggregation and the construction of price indexes. Journal of Econometrics, 161(1), 24–35. https://doi.org/10.1016/j.jeconom.2010.09.003
Organisation for Economic Co-operation and Development, European Union, & Joint Research Centre. (2008). Handbook on constructing composite indicators: Methodology and user guide. OECD Publishing. https://doi.org/10.1787/9789264043466-en
Paruolo, P., Saisana, M., & Saltelli, A. (2013). Ratings and rankings: Voodoo or science? Journal of the Royal Statistical Society Series A: Statistics in Society, 176(3), 609–634. https://doi.org/10.1111/j.1467-985X.2012.01059.x
Saisana, M., Saltelli, A., & Tarantola, S. (2005). Uncertainty and sensitivity analysis techniques as tools for the quality assessment of composite indicators. Journal of the Royal Statistical Society Series A: Statistics in Society, 168(2), 307–323. https://doi.org/10.1111/j.1467-985X.2005.00350.x
Saltelli, A. (2007). Composite indicators between analysis and advocacy. Social Indicators Research, 81(1), 65–77. https://doi.org/10.1007/s11205-006-0024-9