
Statistics · Communication and misuse
A Practical Framework for Statistical Quality Assurance
A stage-by-stage framework for checking statistical work, from planning to reporting, with practical checks, a worked example and the common failures that quality assurance is designed to catch.
Most statistical errors that reach decision-makers are not subtle failures of theory. They are a wrong filter, a stale weighting target, a mislabelled column or a chart built from last month's file. Statistical quality assurance is the set of planned, documented checks that make such errors unlikely and catch the ones that still happen. It differs from quality control of a single output: assurance is about the process that produces every output. This article sets out a practical framework that any analytics or research team can adapt.
What "quality" means for statistics
Quality is fitness for use, not freedom from all error. Statistics Canada (2019) describes quality through six dimensions: relevance, accuracy, timeliness, accessibility, interpretability and coherence. A figure can be accurate yet useless if it arrives too late, or timely yet misleading if users cannot tell how it was defined. Survey researchers add the total survey error perspective, which lists every source of error from coverage and sampling to measurement and processing, and asks which ones matter most for the intended use (Biemer, 2010; Groves & Lyberg, 2010). A quality assurance framework puts these ideas into routine practice.
Why errors persist
Errors are common even in expert work. Herndon et al. (2014) showed that an influential study of public debt and economic growth contained a spreadsheet error that left several countries out of a key average, alongside questionable weighting choices. Ziemann et al. (2016) found that roughly one in five genetics papers with supplementary Excel gene lists contained gene names that the software had silently converted into dates. Neither case involved advanced methods; both involved routine data handling without independent checks.
A second source of error is analytic flexibility. When analysts make many small choices after seeing the data, such as which outliers to drop or which subgroups to report, false findings become much more likely (Simmons et al., 2011). Quality assurance therefore covers decisions as well as arithmetic.
The framework: five stages, gates and a feedback loop
The framework in Figure 1 follows a project through five stages. Each stage has defined checks, and a quality gate between stages means the work moves on only when those checks are complete and signed off. An error log feeds back into the checks so the process improves over time.
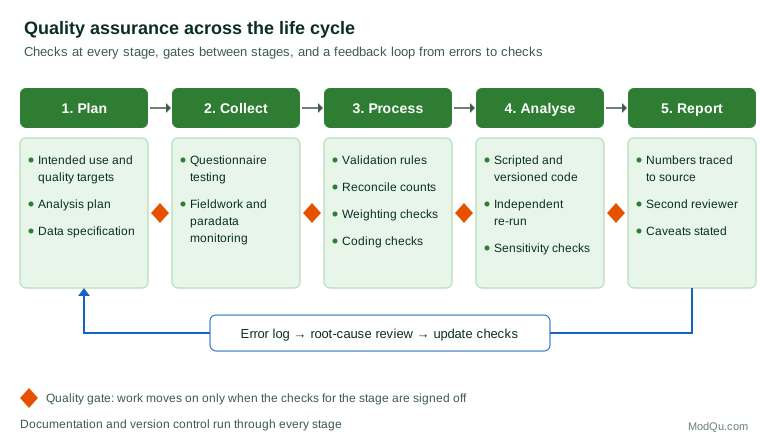
1. Plan
Write down the intended use, the key estimates and the accuracy they need. Draft an analysis plan that fixes the main outcomes, subgroups and tests before the data arrive; pre-specifying analyses protects against unintended data dredging (Nosek et al., 2018). Agree a data specification: variable names, codes, valid ranges and the expected number of records.
2. Collect
Test the questionnaire or extraction query before full fieldwork. During collection, monitor response rates, completion times and the distribution of key answers, so problems are fixed while there is still time. Sudden changes in these indicators often reveal a routing fault or a data feed that has stopped updating.
3. Process
Apply automated data validation rules: ranges, logical consistency (no 16-year-old retirees), required fields and duplicate records. Reconcile record counts at every step of the pipeline, so that rows lost in a merge are noticed. Check that weighted totals match their targets and that coded open-ended answers agree with the source text. Store data in a consistent, tidy structure with one variable per column and one observation per row, which makes errors easier to see and code easier to check (Wickham, 2014). Broman and Woo (2018) give practical rules for spreadsheets when they cannot be avoided: one value per cell, consistent codes, no formatting used as data, and a data dictionary.
4. Analyse
Do the analysis in scripts rather than by hand, keep the scripts under version control and record software versions, so that every number can be regenerated (Peng, 2011; Sandve et al., 2013). Wilson et al. (2017) describe a "good enough" set of computing practices that small teams can adopt without specialist tools. For important outputs, have a second analyst re-run or independently reproduce the key estimates. Test whether conclusions survive reasonable alternative choices, such as a different outlier rule or weighting scheme.
5. Report
Trace every number in the report to a specific output file, and have a reviewer who did not do the analysis check the text, tables and charts against those files. State the main limitations and the uncertainty around key estimates. Kass et al. (2016) recommend that analysts tell a clear story while being honest about what the data cannot show. Professional guidance also makes accuracy and transparency an ethical duty, not just good practice (American Statistical Association, 2022).
Roles and governance
A framework only works if someone owns it. In a small team, a simple division is enough: the analyst who builds an output, a reviewer who checks it, and a quality lead who maintains the checklists, keeps the error log and decides when a gate can be passed under time pressure. Larger organisations often add a written quality policy, periodic audits of completed projects and training for new staff. Whatever the structure, sign-offs should be recorded, and a reviewer should have the authority to stop a release. When deadlines force a gate to be skipped, the decision and its risks should be written down, so the shortcut does not quietly become the norm.
A worked example
Consider a hypothetical monthly brand-tracking survey with about 1,000 completed interviews per wave. The team adopts the framework and records each problem in an error log, noting where it was caught. Over one illustrative quarter the log looks like this:
| Stage where caught | Example issue | Issues logged |
|---|---|---|
| Collect | Routing skipped a question for mobile respondents | 2 |
| Process | Weighting targets still used the previous year's age profile | 3 |
| Analyse | A filter excluded "don't know" answers in one table only | 2 |
| Report | Chart labels swapped between two brands | 1 |
| After release | Typing error in a footnote | 1 |
Eight of the nine issues were caught before release. The root-cause review then changes the process: weighting targets get a version date checked at gate 3, and chart labels are generated from the data rather than typed. The value of the log is not the count itself but the pattern, which shows where new checks will pay off most.
Practical guidance
- Scale checks to risk. A one-off internal estimate needs lighter assurance than a published index or a figure that will drive investment.
- Automate what repeats. Validation rules, reconciliation counts and output comparisons with the previous wave should run every time without anyone remembering to do them.
- Separate doing from checking. A reviewer who did not build the analysis sees mistakes the author cannot.
- Keep an audit trail. Record decisions, data versions and sign-offs so any figure can be explained months later.
- Make data findable and reusable. Clear metadata and documented formats help future users and auditors.
Common mistakes
- Checking only the final report. By then, errors are expensive to fix and easy to miss.
- Treating reproducibility as optional. If a result cannot be regenerated from raw data and code, it cannot really be checked.
- Relying on reasonableness alone. A figure that looks plausible may still be wrong, and a surprising one may be right.
- Letting checklists go stale. Checks written for last year's questionnaire or data feed may no longer test what matters.
- Blaming individuals. Errors are usually symptoms of a process gap; fixing the process prevents repeats.
Key takeaways
Statistical quality assurance turns good intentions into routine. Define quality in terms of the intended use, build checks into every stage from planning to reporting, use gates so problems do not travel downstream, and learn from an error log. Scripted, documented and independently reviewed work is not only more accurate but also easier to defend when results are questioned.
References
American Statistical Association. (2022). Ethical guidelines for statistical practice. American Statistical Association, Committee on Professional Ethics.
Biemer, P. P. (2010). Total survey error: Design, implementation, and evaluation. Public Opinion Quarterly, 74(5), 817–848. https://doi.org/10.1093/poq/nfq058
Broman, K. W., & Woo, K. H. (2018). Data organization in spreadsheets. The American Statistician, 72(1), 2–10. https://doi.org/10.1080/00031305.2017.1375989
Groves, R. M., & Lyberg, L. (2010). Total survey error: Past, present, and future. Public Opinion Quarterly, 74(5), 849–879. https://doi.org/10.1093/poq/nfq065
Herndon, T., Ash, M., & Pollin, R. (2014). Does high public debt consistently stifle economic growth? A critique of Reinhart and Rogoff. Cambridge Journal of Economics, 38(2), 257–279. https://doi.org/10.1093/cje/bet075
Kass, R. E., Caffo, B. S., Davidian, M., Meng, X.-L., Yu, B., & Reid, N. (2016). Ten simple rules for effective statistical practice. PLoS Computational Biology, 12(6), Article e1004961. https://doi.org/10.1371/journal.pcbi.1004961
Nosek, B. A., Ebersole, C. R., DeHaven, A. C., & Mellor, D. T. (2018). The preregistration revolution. Proceedings of the National Academy of Sciences, 115(11), 2600–2606. https://doi.org/10.1073/pnas.1708274114
Peng, R. D. (2011). Reproducible research in computational science. Science, 334(6060), 1226–1227. https://doi.org/10.1126/science.1213847
Sandve, G. K., Nekrutenko, A., Taylor, J., & Hovig, E. (2013). Ten simple rules for reproducible computational research. PLoS Computational Biology, 9(10), Article e1003285. https://doi.org/10.1371/journal.pcbi.1003285
Simmons, J. P., Nelson, L. D., & Simonsohn, U. (2011). False-positive psychology: Undisclosed flexibility in data collection and analysis allows presenting anything as significant. Psychological Science, 22(11), 1359–1366. https://doi.org/10.1177/0956797611417632
Statistics Canada. (2019). Statistics Canada quality guidelines (6th ed., Catalogue No. 12-539-X). https://www150.statcan.gc.ca/n1/en/catalogue/12-539-X
Wickham, H. (2014). Tidy data. Journal of Statistical Software, 59(10). https://doi.org/10.18637/jss.v059.i10
Wilson, G., Bryan, J., Cranston, K., Kitzes, J., Nederbragt, L., & Teal, T. K. (2017). Good enough practices in scientific computing. PLoS Computational Biology, 13(6), Article e1005510. https://doi.org/10.1371/journal.pcbi.1005510
Ziemann, M., Eren, Y., & El-Osta, A. (2016). Gene name errors are widespread in the scientific literature. Genome Biology, 17(1), Article 177. https://doi.org/10.1186/s13059-016-1044-7