
Intelligence · Market and competitive intelligence
"SWOT and PESTLE Analysis: Uses and Limitations"
SWOT and PESTLE are among the most widely used tools in business planning, and among the most criticised. This article explains where they came from, what they are good for, why they so often produce lists instead of insight, and how to use them as genuine intelligence tools.
Few business tools are as familiar as SWOT analysis, the four-box listing of an organisation's strengths, weaknesses, opportunities and threats. Its frequent companion is PESTLE analysis, a checklist of political, economic, social, technological, legal and environmental factors in the external environment. Both appear in strategy documents, business plans, consulting reports and classrooms around the world. Both are also widely criticised as superficial. This article explains where the tools came from, what they do well, why they often disappoint and how to use them to produce real intelligence rather than decorated lists.
Origins
SWOT analysis grew out of the business policy tradition at Harvard Business School in the 1960s. Learned et al. (1965), in an influential textbook, framed strategy as matching a company's internal capabilities with the opportunities and risks in its environment. The four categories of SWOT express that matching in its simplest form: internal strengths and weaknesses, external opportunities and threats.
PESTLE has roots in environmental scanning. Aguilar (1967), studying how managers learned about their business environment, organised external information into economic, technical, political and social categories. Later writers added legal and environmental factors, and the acronym took several forms, including PEST, STEP and PESTEL. The purpose is the same in each: to make sure that scanning of the external environment covers all the major kinds of change, not only those already on management's mind.
Helms and Nixon (2010), reviewing a decade of academic research that used SWOT, found it applied in fields from business and health care to education and tourism, confirming its reach. They also found that many applications were descriptive, producing lists of factors with limited analysis of how they related to each other or to decisions.
What the tools are good for
Both tools have genuine strengths.
They are easy to understand. Anyone in an organisation can contribute to a SWOT discussion, which makes the tool useful for drawing on knowledge spread across functions and levels.
They prompt breadth. PESTLE forces a team to consider factors outside its usual focus, such as regulatory changes or demographic shifts, that may matter more than the competitive moves it habitually watches. Ansoff (1975) argued that strategic surprises usually announce themselves through weak signals that organisations fail to notice; a structured scan increases the chance of catching them.
They connect inside and outside. SWOT's core idea, matching internal capabilities with external conditions, remains sound. Barney (1991) later gave the internal side a theoretical foundation in the resource-based view: resources that are valuable, rare, hard to imitate and well organised can be sources of sustained advantage. Porter (1980) developed the external side through industry analysis.
They structure conversation. In workshops, the tools give groups a common framework and vocabulary, which can help surface different views.
Why they often disappoint
The criticisms are equally real.
Lists without priorities
Hill and Westbrook (1997), studying SWOT analyses carried out in a sample of manufacturing companies, found that the results were typically long lists of factors, expressed in general terms, with no prioritisation, no verification and little evidence that they were used in subsequent strategy. They concluded, provocatively, that it was time for a "product recall". A SWOT listing twenty strengths and twenty threats, each in a few words, gives decision-makers nothing to act on.
Vague and unverified entries
Entries such as "strong brand", "good people" or "economic uncertainty" are too general to test or use. Without evidence, a claimed strength may be a belief that the organisation holds about itself rather than a fact. Customers may not value the strength; competitors may have the same or better.
Classification problems
The same factor can be a strength and a weakness, or an opportunity and a threat, depending on perspective. A large store network is a strength for convenience and a weakness for costs. A new technology is an opportunity for those who adopt it and a threat to those who do not. Arguments about which box a factor belongs in waste time without adding insight. A better approach is to describe the factor once, then note how it helps and how it hurts, and let the decision at hand determine which effect matters more.
Internal bias
SWOT sessions are vulnerable to the biases of the people taking part. Groups tend to converge on comfortable views, a tendency Janis (1972) called groupthink. People overweight information that confirms their beliefs, a pattern Nickerson (1998) documented across many settings as confirmation bias. Kahneman (2011) describes how intuitive judgements rely on what comes easily to mind; recent or vivid events, which Tversky and Kahneman (1974) showed people judge to be more likely through the availability heuristic, crowd out slower trends. Zajac and Bazerman (1991) showed that managers systematically misjudge competitors, which distorts the assessment of threats.
Static snapshots
Both tools capture a moment. Industries and environments change, and a SWOT completed for an annual plan may be outdated within months. Christensen (1997) showed that the most dangerous threats often emerge from developments that seem unimportant at first, which a static list is likely to dismiss.
Analysis as a substitute for thinking
Mintzberg (1994) argued that formal planning tools can substitute analysis for strategic thinking, producing documents that look rigorous but contain no real choices. SWOT and PESTLE are particularly prone to this: completing the boxes can feel like strategy while avoiding the hard decisions about what to do and what not to do.
Using the tools well
The research suggests that the tools themselves are not the problem; the way they are used is. Several practices turn them into intelligence instruments.
Start from a question
A SWOT or PESTLE should address a specific decision or issue: whether to enter a market, how to respond to a new competitor, what to prioritise next year. Grant (2016) notes that strategic analysis is useful only when it is directed at a strategic question. A general-purpose SWOT of "the company" is rarely useful.
Demand evidence
Each entry should be supported by evidence and, where possible, measured. "Strong brand" becomes "brand preference among target customers 12 points higher than the nearest rival in our 2026 survey". A claimed strength that cannot be evidenced is a hypothesis to be tested, not a fact.
Compare with competitors
Strengths and weaknesses are relative. A capability is a strength only if it is better than competitors' and matters to customers. Assessing each factor against the main competitors turns an inward-looking list into a competitive comparison.
Prioritise
Limit each box to the few factors that matter most for the decision. Rate external factors by likelihood and impact, and internal factors by importance to customers and difference from competitors.
Turn findings into options
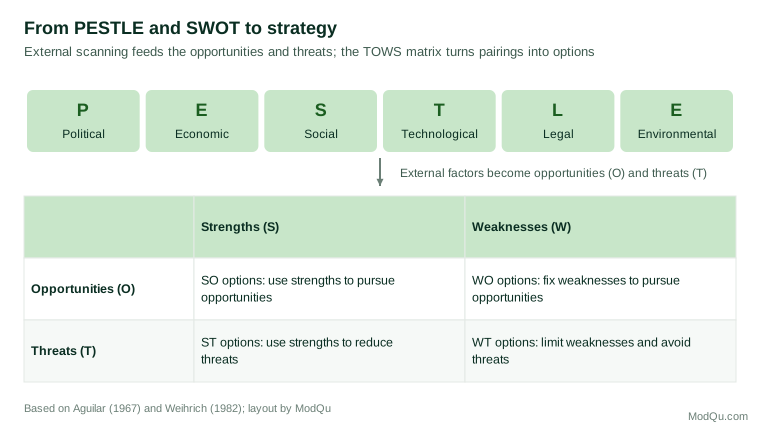
Weihrich (1982) proposed the TOWS matrix, which pairs each external factor with internal ones to generate strategic options, as Figure 1 shows. SO options use strengths to pursue opportunities; WO options address weaknesses to take advantage of opportunities; ST options use strengths to reduce threats; WT options minimise weaknesses and avoid threats. The matrix moves the analysis from description to choice.
Counter bias
Structured techniques help counter the biases described above. Heuer (1999) recommends making assumptions explicit and seeking evidence that would disconfirm them. Assigning someone to argue the opposite case, inviting outsiders and asking "what would have to be true for this to be wrong?" all help.
Make it continuous
Gilad (2004) argues that intelligence should provide early warning, not annual snapshots. PESTLE factors can be turned into indicators monitored over time: regulatory consultations, interest rates, demographic data, technology adoption rates, environmental regulations. Choo (1996) describes how organisations make sense of environmental change through continuing cycles of scanning, interpretation and action rather than one-time studies.
Use scenarios for uncertainty
When important external factors are highly uncertain, scenarios are more useful than lists. Schoemaker (1995) describes scenario planning as a disciplined method for imagining several plausible futures, built from the key uncertainties and trends. PESTLE scanning can identify the driving forces; scenarios show how they might combine.
Fleisher and Bensoussan (2015) recommend treating SWOT and PESTLE as entry points that lead into more rigorous techniques, rather than as complete analyses in themselves.
Sources for each PESTLE factor
A PESTLE analysis is only as good as the information behind it. For each factor, reliable sources exist that can turn general statements into evidence:
- Political: government budgets and policy statements, election platforms, trade agreements, records of legislative debates and consultations, and international sanctions lists.
- Economic: central bank reports and interest rate decisions, national statistics on output, employment, inflation and household spending, exchange rates, and commodity prices.
- Social: census data, population projections, time-use and consumer surveys, and research on changing attitudes and lifestyles.
- Technological: patent filings, research publications, technology adoption statistics, standards bodies, and investment flows into new technologies.
- Legal: proposed and enacted legislation, regulatory consultations, court decisions and enforcement actions in the industry.
- Environmental: climate and weather data, emissions regulations, resource prices, and disclosure requirements for environmental risks.
Recording the source and date of each item makes it possible to check entries, update them and see which have changed since the last review. It also exposes entries that rest on nothing more than general impressions.
Common mistakes and how to avoid them
Practitioners can avoid most of the weaknesses described above by watching for a few recurring mistakes:
- Confusing internal and external factors. "A new competitor" is an external threat; "slow product development" is an internal weakness. Keeping the distinction clear makes the TOWS pairing meaningful.
- Listing aspirations as strengths. "Customer focus" written into the strengths box because it is a company value is not evidence that customers experience it.
- Treating every external change as relevant. A PESTLE analysis should include only factors that plausibly affect the decision at hand, not every trend in the news.
- Ignoring timing. An opportunity that will open in five years calls for different action from one available now. Noting the expected timing of each factor helps set priorities.
- Stopping at the boxes. The analysis is complete only when it has produced options, a choice and indicators to monitor.
SWOT and PESTLE in a wider toolkit
SWOT and PESTLE work best alongside other methods. PESTLE identifies broad forces; industry analysis, such as Porter's (1980) five forces, shows how those forces affect competition in a specific market. SWOT identifies strengths and weaknesses; competitor profiling and benchmarking test whether they are real. Scenario planning explores combinations of uncertain external factors, and structured analytic techniques test the assumptions behind conclusions. Used in this way, SWOT and PESTLE serve as a summary and a bridge: they organise the findings of more detailed analysis in a form that decision-makers can grasp quickly and connect to choices.
An illustration
A Canadian craft brewery asks whether to expand into neighbouring provinces. A conventional SWOT might list "quality products", "loyal local following", "limited capital" and "growing craft beer market", which says little.
An intelligence-led version starts from the expansion question. PESTLE scanning identifies specific factors: provincial liquor regulations that differ in how out-of-province brewers can distribute; rising aluminium can prices; changing alcohol consumption among younger adults; and new labelling requirements. Each factor is evidenced and rated for impact on the expansion decision. Internal factors are assessed against the competitors the brewery would face: blind taste-test results, production capacity utilisation, distribution relationships and marketing budget relative to regional rivals.
The TOWS matrix then generates options. An SO option uses award-winning products and a strong tourism profile to enter through tourist regions and festivals. A WO option addresses limited distribution by partnering with an established distributor. An ST option counters declining youth consumption by expanding low-alcohol lines, where the brewery already has a strength. A WT option avoids the province whose distribution rules most disadvantage small brewers. Management chooses a phased entry into one province through a distributor, with indicators to monitor before a second phase. The indicators include sales per outlet in the first province, the distributor's on-time delivery rate, changes to the second province's distribution rules, which are under review, and aluminium can prices. If sales per outlet reach an agreed level within eighteen months and the rules change as expected, the brewery will proceed to the second province; if not, it will consolidate. The SWOT has become a decision with explicit conditions for revisiting it.
Conclusion
SWOT and PESTLE endure because they are simple, inclusive and grounded in the sound idea of matching internal capabilities with external conditions. They disappoint when they produce unprioritised, unevidenced lists that substitute for thinking. Used as part of an intelligence process, starting from a decision, demanding evidence, comparing with competitors, prioritising, generating options and monitoring change, they can be genuinely useful. The lesson of the research is not to abandon the tools but to stop treating the completed boxes as the end of the analysis.
References
Aguilar, F. J. (1967). Scanning the business environment. Macmillan.
Ansoff, H. I. (1975). Managing strategic surprise by response to weak signals. California Management Review, 18(2), 21–33. https://doi.org/10.2307/41164635
Barney, J. (1991). Firm resources and sustained competitive advantage. Journal of Management, 17(1), 99–120. https://doi.org/10.1177/014920639101700108
Choo, C. W. (1996). The knowing organization: How organizations use information to construct meaning, create knowledge and make decisions. International Journal of Information Management, 16(5), 329–340. https://doi.org/10.1016/0268-4012(96)00020-5
Christensen, C. M. (1997). The innovator's dilemma: When new technologies cause great firms to fail. Harvard Business School Press.
Fleisher, C. S., & Bensoussan, B. E. (2015). Business and competitive analysis: Effective application of new and classic methods (2nd ed.). Pearson Education.
Gilad, B. (2004). Early warning: Using competitive intelligence to anticipate market shifts, control risk, and create powerful strategies. AMACOM.
Grant, R. M. (2016). Contemporary strategy analysis: Text and cases (9th ed.). Wiley.
Helms, M. M., & Nixon, J. (2010). Exploring SWOT analysis – where are we now? A review of academic research from the last decade. Journal of Strategy and Management, 3(3), 215–251. https://doi.org/10.1108/17554251011064837
Heuer, R. J., Jr. (1999). Psychology of intelligence analysis. Center for the Study of Intelligence, Central Intelligence Agency.
Hill, T., & Westbrook, R. (1997). SWOT analysis: It's time for a product recall. Long Range Planning, 30(1), 46–52. https://doi.org/10.1016/S0024-6301(96)00095-7
Janis, I. L. (1972). Victims of groupthink: A psychological study of foreign-policy decisions and fiascoes. Houghton Mifflin.
Kahneman, D. (2011). Thinking, fast and slow. Farrar, Straus and Giroux.
Learned, E. P., Christensen, C. R., Andrews, K. R., & Guth, W. D. (1965). Business policy: Text and cases. Richard D. Irwin.
Mintzberg, H. (1994). The rise and fall of strategic planning. Free Press.
Nickerson, R. S. (1998). Confirmation bias: A ubiquitous phenomenon in many guises. Review of General Psychology, 2(2), 175–220. https://doi.org/10.1037/1089-2680.2.2.175
Porter, M. E. (1980). Competitive strategy: Techniques for analyzing industries and competitors. Free Press.
Schoemaker, P. J. H. (1995). Scenario planning: A tool for strategic thinking. Sloan Management Review, 36(2), 25–40.
Tversky, A., & Kahneman, D. (1974). Judgment under uncertainty: Heuristics and biases. Science, 185(4157), 1124–1131. https://doi.org/10.1126/science.185.4157.1124
Weihrich, H. (1982). The TOWS matrix—A tool for situational analysis. Long Range Planning, 15(2), 54–66. https://doi.org/10.1016/0024-6301(82)90120-0
Zajac, E. J., & Bazerman, M. H. (1991). Blind spots in industry and competitor analysis: Implications of interfirm (mis)perceptions for strategic decisions. Academy of Management Review, 16(1), 37–56. https://doi.org/10.5465/amr.1991.4278990