
Intelligence · Business intelligence
Data Warehouses, Data Lakes and the Architecture of Business Intelligence
Where an organisation stores its data for analysis shapes what it can learn. This article explains data warehouses, data lakes and the newer lakehouse design, how they differ, and how to choose between them.
Business intelligence depends on having data in a place and form suited to analysis. The systems that run a business, such as order processing, accounting and customer service, are designed to record transactions quickly and reliably. They are poor at answering questions that span years of history or combine data from several systems. For that reason, organisations build separate analytical stores. Three designs dominate: the data warehouse, the data lake and, more recently, the lakehouse.
Why separate analysis from operations
Codd (1970) laid the foundations of the relational database, which organises data in tables linked by shared keys and remains the basis of most business systems. Relational systems used for transactions are optimised to update individual records. Analytical queries, by contrast, read millions of records at once to compute totals and trends. Running such queries on transaction systems slows them down and gives inconsistent answers, because each system defines and stores data differently. Stonebraker and Çetintemel (2005) argued that no single database design can serve all these needs well, and that specialised systems for different workloads would replace the "one size fits all" approach.
The data warehouse
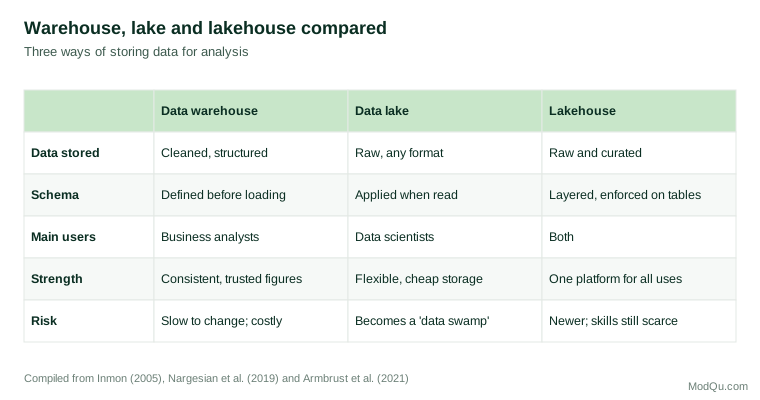
Inmon (2005) defined the data warehouse as a subject-oriented, integrated, time-variant and non-volatile collection of data in support of management decisions. Data are extracted from operational systems, cleaned, reconciled to common definitions and loaded on a schedule. The warehouse keeps history, so that analysts can compare this year with last year, and it provides a single, consistent set of figures.
Two design philosophies shaped warehouse practice. Inmon favoured a central, normalised enterprise warehouse from which departmental data marts are fed. Kimball and Ross (2013) favoured building the warehouse from dimensional models: fact tables recording business events, such as sales, linked to dimension tables describing customers, products, stores and dates. This "star schema" is easy for users to understand and efficient for queries. Chaudhuri and Dayal (1997) describe how warehouses and online analytical processing tools were designed together so that users could explore such data interactively.
Warehouses excel at producing trusted, consistent figures for reporting. Their weakness is rigidity: the structure must be designed before data are loaded, so adding new sources or answering unanticipated questions can take months. Watson and Wixom (2007) note that getting data into the warehouse is typically the hardest and most expensive part of business intelligence.
The data lake
The growth of web logs, sensor readings, text, images and other data that do not fit neatly into tables led to a different approach. Distributed processing frameworks, building on ideas such as MapReduce (Dean & Ghemawat, 2008), made it cheap to store and process very large volumes of data across clusters of ordinary computers. A data lake stores data in its raw form, applying structure only when the data are read for a particular analysis.
This flexibility suits exploratory work and data science, where analysts do not know in advance which data will matter. But Nargesian et al. (2019) describe the challenges of managing lakes: without good metadata, users cannot find relevant data, understand what it means or judge its quality. Poorly managed lakes become "data swamps" in which data are stored but never used.
The lakehouse
Armbrust et al. (2021) proposed the lakehouse, which stores data in open formats in low-cost storage, like a lake, but adds a management layer providing the reliability, structure and performance of a warehouse. Raw data land in one zone, are cleaned and structured in another, and are published as curated tables for reporting. The aim is a single platform serving both business reporting and data science, avoiding the cost and inconsistency of copying data between separate systems.
An example
An online retailer illustrates how the designs can work together. Its finance and merchandising teams need daily sales, margin and stock figures that match the accounts exactly. Those figures come from curated tables with agreed definitions of revenue, returns and discounts, refreshed every night and checked against the finance system. This is warehouse-style data, whether it sits in a traditional warehouse or in the curated zone of a lakehouse.
The same retailer's data scientists want to study how customers move through the website before buying, using billions of raw click events, search terms and product images. They need the raw data, not summaries, and they do not know in advance which features will prove useful. This is lake-style data. If both kinds of data sit on one platform, the data scientists can join their behavioural findings to the trusted sales figures without copying data between systems, and new measures that prove valuable can be promoted into the curated tables for everyone to use.
Choosing an architecture
No design is best for every organisation. Kleppmann (2017) emphasises that data system design involves trade-offs between reliability, scalability and maintainability, and that the right choice depends on the workloads and the people who will use the system. A useful set of questions follows:
- What decisions must the data support? Regular financial and operational reporting needs consistent, governed figures; exploratory analysis needs flexibility.
- What kinds of data are involved? Mainly structured transactions favour a warehouse; large volumes of logs, text or images favour a lake or lakehouse.
- Who will use it? Business analysts need clear, documented tables; data scientists can work with rawer data.
- What skills are available? Newer architectures require skills that small organisations may lack.
Whatever the design, the same principles apply: document what each dataset means, assign owners responsible for quality, and organise data around the questions the business needs to answer. Architecture determines what is possible; governance and purpose determine whether it is useful.
References
Armbrust, M., Ghodsi, A., Xin, R., & Zaharia, M. (2021). Lakehouse: A new generation of open platforms that unify data warehousing and advanced analytics. In Proceedings of the 11th Conference on Innovative Data Systems Research (CIDR).
Chaudhuri, S., & Dayal, U. (1997). An overview of data warehousing and OLAP technology. ACM SIGMOD Record, 26(1), 65–74. https://doi.org/10.1145/248603.248616
Codd, E. F. (1970). A relational model of data for large shared data banks. Communications of the ACM, 13(6), 377–387. https://doi.org/10.1145/362384.362685
Dean, J., & Ghemawat, S. (2008). MapReduce: Simplified data processing on large clusters. Communications of the ACM, 51(1), 107–113. https://doi.org/10.1145/1327452.1327492
Inmon, W. H. (2005). Building the data warehouse (4th ed.). Wiley.
Kimball, R., & Ross, M. (2013). The data warehouse toolkit: The definitive guide to dimensional modeling (3rd ed.). Wiley.
Kleppmann, M. (2017). Designing data-intensive applications. O'Reilly Media.
Nargesian, F., Zhu, E., Miller, R. J., Pu, K. Q., & Arocena, P. C. (2019). Data lake management: Challenges and opportunities. Proceedings of the VLDB Endowment, 12(12), 1986–1989. https://doi.org/10.14778/3352063.3352116
Stonebraker, M., & Çetintemel, U. (2005). "One size fits all": An idea whose time has come and gone. In Proceedings of the 21st International Conference on Data Engineering (pp. 2–11). IEEE. https://doi.org/10.1109/ICDE.2005.1
Watson, H. J., & Wixom, B. H. (2007). The current state of business intelligence. Computer, 40(9), 96–99. https://doi.org/10.1109/MC.2007.331