
Intelligence · Business intelligence
"Key Performance Indicators: Selection, Design and Misuse"
Key performance indicators condense an organisation's performance into a few numbers. This article explains how to choose and design good indicators, what research shows about how they change behaviour, and how they are distorted and misused.
Managers cannot watch everything. A business of any size generates thousands of possible measures every week, from sales by product and region to staff turnover, delivery times and complaints. Key performance indicators (KPIs) are the small set of measures an organisation chooses to track closely because they are believed to show whether it is achieving what matters most. Chosen well, they focus attention, reveal problems early and help people see the effect of their work. Chosen badly, or used carelessly, they distort behaviour and create the appearance of success while the real goal is missed.
This article explains what makes a good KPI, how indicators shape behaviour, and the ways they are commonly misused. It draws on research in management accounting, public administration and psychology.
What a KPI is, and is not
Neely et al. (1995) define performance measurement as the process of quantifying the efficiency and effectiveness of action. A performance indicator is a specific measure used in that process. A key performance indicator is one judged critical to the organisation's success, selected from the many measures that could be tracked.
Parmenter (2015) draws a useful distinction between several kinds of measure. Key result indicators summarise overall outcomes, such as profit or customer satisfaction; they show whether the organisation has succeeded but not what to do about it. Performance indicators track particular activities. Key performance indicators, in Parmenter's narrower sense, are the few measures that teams can act on frequently and that drive the outcomes the organisation cares about. Parmenter argues that most organisations track far too many measures and call all of them KPIs, diluting attention.
A KPI is not the goal itself. It is evidence about progress towards the goal. That distinction sounds obvious, but much of the misuse described below begins when an organisation forgets it.
Why indicators matter: the evidence on goals
The power of KPIs comes partly from their role as goals. Locke and Latham (2002), summarising decades of research, found that specific and challenging goals lead to higher performance than vague goals such as "do your best". Goals direct attention, increase effort and persistence, and encourage people to develop strategies to reach them. Feedback on progress, which indicators provide, strengthens these effects.
This is why the familiar advice that objectives should be SMART, specific, measurable, assignable, realistic and time-related in Doran's (1981) original formulation, has lasting appeal. Clear, measurable targets give people something definite to aim at.
The same research, however, contains a warning. Ordóñez et al. (2009) argued that goal-setting has systematic side effects that its advocates often overlook. Narrow goals can lead people to neglect important aspects of performance that are not measured; challenging goals can encourage risk-taking and unethical behaviour; and goals can reduce intrinsic motivation and cooperation. They cited cases in which aggressive targets encouraged staff to mislead customers in order to meet sales quotas. The power of indicators to focus attention is also their power to misdirect it.
Selecting indicators
Start from strategy
Kaplan and Norton (1992) introduced the balanced scorecard in response to the tendency of companies to manage mainly by financial measures, which report the results of past actions but say little about what will drive future performance. They proposed measures across four perspectives: financial, customer, internal business processes, and learning and growth. Kaplan and Norton (1996) later emphasised that the measures should be linked by an explicit theory of how the business creates value: investment in staff skills improves processes, better processes improve customer outcomes, and better customer outcomes improve financial results.
The key idea is that indicators should be chosen to test and manage a strategy, not simply because data happen to be available. Each indicator should answer the question: if this measure improves, why do we believe the business will do better?
Test the links
Ittner and Larcker (2003) studied how companies used nonfinancial performance measures and found that many failed to identify which measures actually drove results. Firms chose measures based on intuition, industry practice or availability, and few tested whether improvements in the measures were followed by improvements in financial performance. Companies that did test and validate these links earned higher returns. The lesson is that KPIs are hypotheses about what matters, and like other hypotheses they should be checked against evidence.
A well-known example is the Net Promoter Score, based on customers' answers to a single question about how likely they are to recommend a company. Reichheld (2003) promoted it as the one number a company needed to predict growth. Keiningham et al. (2007), testing the claim with data from many firms, found that the score was not a better predictor of revenue growth than other customer satisfaction measures. The score may still be useful, but the example shows the danger of adopting an indicator on the strength of a persuasive claim rather than evidence in one's own business.
Balance leading and lagging measures
Lagging indicators report outcomes after the fact: quarterly revenue, annual staff turnover, customer churn. Leading indicators measure activities or conditions expected to influence those outcomes later: sales pipeline, employee engagement, product quality. A useful set of KPIs combines both. Lagging measures confirm whether the strategy is working; leading measures give time to act before results deteriorate.
Keep the set small
Attention is limited. Eppler and Mengis (2004), reviewing research on information overload, found that beyond a certain point additional information reduces the quality of decisions because people cannot process it. A dashboard with fifty indicators gives no indication of which ones matter. Parmenter (2015) recommends a small number of true KPIs at each level of the organisation, with other measures available for diagnosis when needed.
Designing each indicator
Once an indicator has been chosen, its design determines whether it will be useful. Several questions need clear answers.
- Definition. Exactly what is counted, and what is excluded? "Customer complaints" may include or exclude complaints resolved on the first call, complaints received by social media, or repeated complaints from the same customer.
- Data source and quality. Where does the data come from, and how reliable is it? Wang and Strong (1996) showed that people judge data by its relevance, timeliness, interpretability and accessibility as well as its accuracy.
- Frequency. How often is it measured and reviewed? Indicators reviewed too rarely lose their power to prompt action; indicators reviewed too often invite overreaction to random fluctuation.
- Owner. Who is responsible for the indicator and for acting when it moves?
- Target and thresholds. What level counts as good or bad, and on what basis was it set?
- Context. What comparison makes the number meaningful: last year, a forecast, a competitor, or a target?
Distinguish signal from noise
Every measure varies from period to period for reasons that have nothing to do with management action. Shewhart (1931), working on manufacturing quality, distinguished common-cause variation, the routine fluctuation inherent in any process, from special-cause variation, which signals that something has changed. Managers who react to every rise or fall in a KPI as though it were meaningful waste effort and may make things worse. Plotting indicators over time with limits that show the expected range of routine variation helps separate real changes from noise.
Few (2006) makes the same point from the perspective of display design: indicators should be shown with enough context, such as a trend and a target, for the viewer to judge whether a value is good, bad or simply normal.
How indicators are misused
The most important body of research on KPIs concerns what happens when people are judged by them.
Goodhart's and Campbell's laws
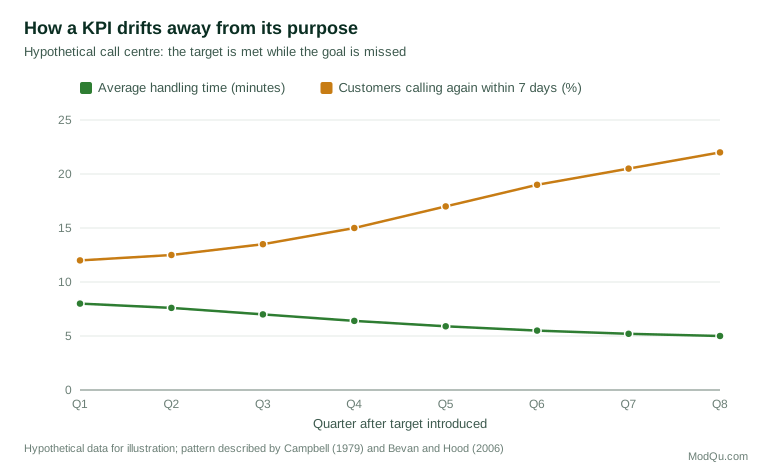
Strathern (1997), discussing the spread of audit in British universities, summarised a principle originally stated by the economist Charles Goodhart: "When a measure becomes a target, it ceases to be a good measure." Campbell (1979) made a similar observation about social programmes: the more any quantitative indicator is used for social decision-making, the more it will be subject to corruption pressures, and the more it will distort the processes it is meant to monitor.
The mechanism is simple. A measure is useful because it is correlated with something we care about. Once people are rewarded for the measure, they look for the cheapest ways to improve it, and those ways may not improve the underlying goal at all. The correlation that made the measure useful then weakens or disappears.
Rewarding A while hoping for B
Kerr (1975) catalogued cases in which organisations rewarded one behaviour while hoping for another: universities that hoped for good teaching but rewarded research publications; businesses that hoped for long-term growth but rewarded quarterly earnings. People respond to what is rewarded, not to what is hoped for. Ridgway (1956), in one of the earliest studies of the problem, documented how single measures in government and industry led staff to concentrate on the measured part of their work at the expense of everything else, and how even multiple measures could be traded off in unintended ways.
Gaming in practice
Bevan and Hood (2006) studied the targets introduced for the English National Health Service in the early 2000s. Performance on the targeted measures improved markedly, but they also found evidence of gaming. They describe three forms. Ratchet effects occur when next year's target is based on this year's performance, so managers avoid exceeding targets. Threshold effects occur when a uniform target encourages all units to aim just for it, so that the best performers do worse than they could. Output distortion occurs when targets are met by manipulating what is measured, for example by reclassifying cases or changing when the clock starts, rather than by improving the underlying service.
Muller (2018) argues that many organisations suffer from metric fixation: the belief that measured performance can replace professional judgement, that publishing and rewarding metrics will improve results, and that whatever cannot be measured does not matter. Muller documents the costs in medicine, education, policing and business, including time spent on reporting, discouragement of innovation and the loss of activities that are hard to quantify.
Biased interpretation
Misuse does not require deliberate gaming. Lipe and Salterio (2000) asked managers to evaluate business units using balanced scorecards that contained both measures common to all units and measures unique to each. Evaluators relied heavily on the common measures and largely ignored the unique ones, even though the unique measures had been chosen to reflect each unit's particular strategy. The result was to undermine the purpose of tailoring indicators to strategy.
An illustration: a subscription business
Consider a company that sells software by monthly subscription. Its leaders agree that the strategic goal is profitable growth through loyal customers. A first attempt at KPIs lists thirty measures, from website visits to server uptime. Few managers can say which matter most.
A more disciplined approach starts with the strategy's logic. Revenue grows when the company gains customers and keeps them. Keeping customers depends on whether they succeed in using the product. Success in using the product depends on onboarding and support. From this chain the company selects a small set of indicators: monthly recurring revenue as the key result; new customers and customer churn as the main drivers; the share of new customers who use the product's core features within thirty days as a leading indicator of churn; and time to resolve support requests as a process measure.
Each indicator gets a precise definition. Churn, for instance, is defined as the share of customers at the start of a month who cancel during it, excluding customers moved to a different plan. Each has an owner and a review rhythm: the leadership team reviews revenue and churn monthly; the onboarding team reviews feature adoption weekly.
To guard against distortion, the company pairs measures. Support resolution time is reviewed alongside the share of requests reopened by customers, so that agents are not rewarded for closing requests prematurely. New customer numbers are reviewed alongside churn among customers acquired in each month, so that sales staff are not rewarded for signing up customers who leave soon after.
After a year, the company tests its assumptions. It finds that early feature adoption does predict lower churn, confirming the indicator's value. It also finds that support resolution time has little relationship with churn once adoption is taken into account, so it reduces the attention given to that measure and adds one on product reliability instead. The set of KPIs has become a tested model of how the business works, revised in the light of evidence.
Using KPIs well
The research does not suggest abandoning indicators, which remain essential for managing anything of size. It suggests using them with care.
- Tie indicators to strategy. Each KPI should reflect an explicit hypothesis about what drives success (Kaplan & Norton, 1996).
- Test the hypotheses. Check whether improvements in leading measures are actually followed by better outcomes, and drop indicators that do not predict anything (Ittner & Larcker, 2003).
- Use several measures together. Pair each efficiency measure with a quality measure, such as handling time with repeat calls, so that one cannot easily be improved at the expense of the other.
- Separate learning from judging. Indicators used for diagnosis and improvement are less prone to distortion than indicators tied directly to pay or punishment.
- Look behind the numbers. Combine indicators with direct observation, conversations with staff and customers, and periodic audits of how data are recorded.
- Review and retire. Revisit the set of KPIs regularly; measures that no longer reflect strategy or have been gamed should be changed.
Meadows (2008), writing about complex systems, observes that the goals of a system are among its most powerful leverage points: change what a system is trying to achieve, and its behaviour changes accordingly. KPIs are in effect statements of what an organisation is trying to achieve. That is why they deserve careful design, and why poorly designed indicators can do so much damage.
Davenport and Harris (2007) found that organisations that compete on analytics treat measurement as a discipline: they define measures carefully, test their relationships to results and refine them over time. The same discipline applies to KPIs in any organisation.
Conclusion
Key performance indicators focus attention on what matters, give people goals to aim at and provide early warning when things go wrong. Their power comes from their ability to shape behaviour, which is also the source of their dangers. Indicators that are poorly linked to strategy, untested, too numerous or tied too directly to rewards invite distortion and gaming. Good practice treats each KPI as a hypothesis about success, pairs measures so that none can be improved at the expense of the goal, separates signal from noise, and keeps human judgement at the centre. Measured that way, performance indicators remain one of the most useful tools of business intelligence.
References
Bevan, G., & Hood, C. (2006). What's measured is what matters: Targets and gaming in the English public health care system. Public Administration, 84(3), 517–538. https://doi.org/10.1111/j.1467-9299.2006.00600.x
Campbell, D. T. (1979). Assessing the impact of planned social change. Evaluation and Program Planning, 2(1), 67–90. https://doi.org/10.1016/0149-7189(79)90048-X
Davenport, T. H., & Harris, J. G. (2007). Competing on analytics: The new science of winning. Harvard Business School Press.
Doran, G. T. (1981). There's a S.M.A.R.T. way to write management's goals and objectives. Management Review, 70(11), 35–36.
Eppler, M. J., & Mengis, J. (2004). The concept of information overload: A review of literature from organization science, accounting, marketing, MIS, and related disciplines. The Information Society, 20(5), 325–344. https://doi.org/10.1080/01972240490507974
Few, S. (2006). Information dashboard design: The effective visual communication of data. O'Reilly Media.
Ittner, C. D., & Larcker, D. F. (2003). Coming up short on nonfinancial performance measurement. Harvard Business Review, 81(11), 88–95.
Kaplan, R. S., & Norton, D. P. (1992). The balanced scorecard: Measures that drive performance. Harvard Business Review, 70(1), 71–79.
Kaplan, R. S., & Norton, D. P. (1996). The balanced scorecard: Translating strategy into action. Harvard Business School Press.
Keiningham, T. L., Cooil, B., Andreassen, T. W., & Aksoy, L. (2007). A longitudinal examination of net promoter and firm revenue growth. Journal of Marketing, 71(3), 39–51. https://doi.org/10.1509/jmkg.71.3.039
Kerr, S. (1975). On the folly of rewarding A, while hoping for B. Academy of Management Journal, 18(4), 769–783. https://doi.org/10.5465/255378
Lipe, M. G., & Salterio, S. E. (2000). The balanced scorecard: Judgmental effects of common and unique performance measures. The Accounting Review, 75(3), 283–298. https://doi.org/10.2308/accr.2000.75.3.283
Locke, E. A., & Latham, G. P. (2002). Building a practically useful theory of goal setting and task motivation: A 35-year odyssey. American Psychologist, 57(9), 705–717. https://doi.org/10.1037/0003-066X.57.9.705
Meadows, D. H. (2008). Thinking in systems: A primer. Chelsea Green.
Muller, J. Z. (2018). The tyranny of metrics. Princeton University Press.
Neely, A., Gregory, M., & Platts, K. (1995). Performance measurement system design: A literature review and research agenda. International Journal of Operations & Production Management, 15(4), 80–116. https://doi.org/10.1108/01443579510083622
Ordóñez, L. D., Schweitzer, M. E., Galinsky, A. D., & Bazerman, M. H. (2009). Goals gone wild: The systematic side effects of overprescribing goal setting. Academy of Management Perspectives, 23(1), 6–16. https://doi.org/10.5465/amp.2009.37007999
Parmenter, D. (2015). Key performance indicators: Developing, implementing, and using winning KPIs (3rd ed.). Wiley.
Reichheld, F. F. (2003). The one number you need to grow. Harvard Business Review, 81(12), 46–54.
Ridgway, V. F. (1956). Dysfunctional consequences of performance measurements. Administrative Science Quarterly, 1(2), 240–247. https://doi.org/10.2307/2390989
Shewhart, W. A. (1931). Economic control of quality of manufactured product. Van Nostrand.
Strathern, M. (1997). 'Improving ratings': Audit in the British university system. European Review, 5(3), 305–321.
Wang, R. Y., & Strong, D. M. (1996). Beyond accuracy: What data quality means to data consumers. Journal of Management Information Systems, 12(4), 5–33. https://doi.org/10.1080/07421222.1996.11518099