
Intelligence · Business intelligence
"Self-Service Business Intelligence: Promise and Governance"
Self-service business intelligence lets business users build their own reports and analyses without waiting for specialists. This article explains why it spread, what it promises, the risks it brings, and how governance can keep its benefits without the chaos.
For most of the history of business intelligence, a small team of specialists built reports for everyone else. A sales director who wanted to see revenue by customer segment would submit a request, wait for it to be prioritised, and receive a report weeks later, by which time the question might have changed. Self-service business intelligence promises to end that wait by giving business users tools and data to answer their own questions. It has spread widely, and it has delivered real benefits. It has also created new problems: conflicting numbers, hidden errors and uncertainty about which figures can be trusted. This article explains the promise of self-service BI, its risks, and how organisations can govern it.
Why self-service spread
Traditional BI was built around central data warehouses and reporting teams. Watson and Wixom (2007) note that this model produced consistent, trusted figures but struggled to keep up with demand. Business needs changed faster than central teams could build reports, and backlogs of requests grew. Users responded by exporting data into spreadsheets and building their own analyses, outside any control.
Self-service tools emerged to meet this demand in a more organised way. Alpar and Schulz (2016) describe self-service BI as an approach that enables business users to access and work with corporate information without the involvement of IT specialists for each request. They distinguish levels of self-service, from using prepared reports interactively, through creating new analyses from prepared data, to adding new data sources. Each level gives users more freedom and requires more skill and more governance.
Imhoff and White (2011), in an industry study, identified the conditions that self-service requires: easy access to data sources, tools that non-specialists can use, quick deployment and a well-managed data foundation. The last condition is the one most often neglected.
The promise
The benefits of self-service BI are substantial.
- Speed. Users can answer questions in hours rather than weeks, while the questions are still relevant.
- Relevance. The people closest to a business problem are often best placed to know what data will answer it. Self-service lets them explore directly.
- Reduced backlog. Central teams are freed from routine report requests to concentrate on data foundations and complex analysis.
- Analytical culture. When many people work with data, using evidence becomes a normal part of decision-making. Popovič et al. (2012) found that an analytical decision-making culture was what turned better information into better decisions.
Davenport and Harris (2007) observed that organisations which compete on analytics spread analytical capability widely rather than confining it to a specialist unit. LaValle et al. (2011) found that top-performing organisations used analytics across a broad range of decisions. Self-service is one of the main ways of achieving that breadth.
The risks
The same freedom that makes self-service attractive creates risks.
Conflicting numbers
When each department builds its own reports, each may define key measures differently. Sales may count revenue when an order is signed, finance when it is invoiced, operations when it is shipped. All three figures can be correct by their own definitions and yet contradict each other. Meetings that should discuss what to do instead argue about whose numbers are right.
Hidden errors
Users without training in data and analysis make mistakes: joining tables incorrectly, double-counting, filtering out records by accident or misreading what a field means. Such errors are hard to detect because no one reviews the work. Panko (1998), reviewing studies of spreadsheet development and audits of real spreadsheets, found that errors were common, and that developers were usually unaware of them. Herndon et al. (2014) showed how consequential such errors can be: their re-examination of an influential economic study that had been cited in policy debates found a spreadsheet error that excluded several countries from a key calculation, along with other choices that changed the results.
Sprawl
Self-service tools make it easy to create dashboards and reports, and hard to know which ones are still used, accurate or owned by anyone. Hundreds of similar reports accumulate, consuming storage and maintenance and confusing users about which to trust.
Security and privacy
Wider access to data increases the risk that sensitive information, such as personal data about customers or employees, is copied, shared or exposed inappropriately.
Inconsistent quality
Wang and Strong (1996) showed that users judge data quality by its relevance, timeliness, completeness and interpretability as well as its accuracy. In a self-service environment, users often cannot judge these dimensions for data they did not prepare, and may not know that a dataset is stale or incomplete.
Governing self-service
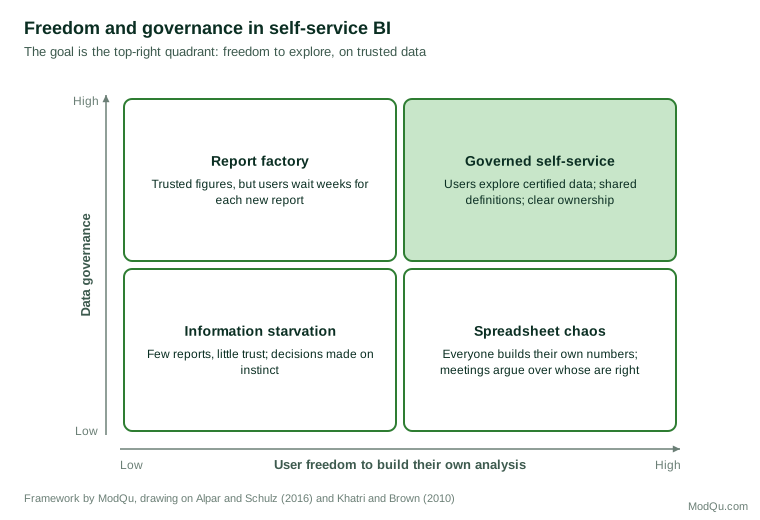
The answer to these risks is not to abandon self-service but to govern it. Figure 1 shows the balance that organisations seek: high freedom for users, built on well-governed data.
Decision rights and ownership
Khatri and Brown (2010) describe data governance as the allocation of decision rights and accountabilities for data. For self-service, the key decisions concern who defines official measures, who certifies datasets as trustworthy, who may access which data, and who is responsible for quality. Otto (2011), studying governance in large companies, found that effective arrangements assign clear roles, including executive sponsors, data owners in the business and data stewards responsible for day-to-day quality.
Weber et al. (2009) argue that there is no single best design: the right governance model depends on the organisation's structure, culture and degree of centralisation. Abraham et al. (2019), reviewing the research, describe governance as combining structural mechanisms such as roles and committees, procedural mechanisms such as policies and standards, and relational mechanisms such as communication and training.
Certified data
A practical approach is to divide data into tiers. Certified datasets are prepared, documented and maintained by a central team or designated owners, with agreed definitions of key measures. Users build their own analyses on top of them, confident that the underlying figures are correct. Exploratory data, including data users bring themselves, is clearly labelled as such. Reports that become important can be promoted to certified status after review.
Shared definitions
A business glossary records the official definition of each key measure and term. DAMA International (2017), in its body of knowledge for data management, treats such metadata as a core governance function: without agreed definitions, data cannot be shared or compared reliably.
Skills
Tools are only as good as the people using them. Training in data literacy, covering how data are structured, common errors and how to read charts honestly, reduces mistakes. Few (2006) argues that good dashboard and report design is a learnable skill, and organisations that invest in it get clearer, more useful work from their users.
Review and retirement
Usage monitoring shows which reports are used and which are not. Periodic reviews retire unused content, consolidate duplicates and identify widely used user-built reports that should be certified.
Organisational conditions
Yeoh and Koronios (2010) found that organisational factors, such as management commitment, a clear vision and business ownership, mattered more to BI success than technology. Self-service is no exception. Wixom and Watson (2010) describe successful BI organisations as balancing central standards with business responsiveness, often through a competency centre that supports users rather than controlling them. Watson (2009) notes that the history of BI has been one of repeated attempts to put information into users' hands; each succeeded where data foundations and governance kept pace.
Measuring whether self-service works
Because self-service is meant to improve decisions, its success should be judged by more than the number of licences issued or reports built. Useful measures include:
- Time to answer. How long does it take a business user to get an answer to a new question, compared with the old request process?
- Share of decisions using certified data. Are important meetings and reports drawing on governed datasets, or on private spreadsheets?
- Disputes over figures. How often do discussions stall because different reports give different numbers?
- Errors found in review. When user-built reports are checked, how many contain significant mistakes, and is the rate falling as training improves?
- Active use. What share of reports and dashboards are opened regularly, and by how many people?
- Backlog of central requests. Has the central team's queue fallen, freeing it for work on data foundations and complex analysis?
Tracking these measures turns self-service from a tool rollout into a managed programme, and gives early warning when freedom is outpacing governance.
An example
A mid-sized distributor introduced a self-service tool and saw usage grow quickly. Within a year, it had more than four hundred user-built reports, and the monthly management meeting regularly stalled over conflicting figures for gross margin. Investigation found three different definitions in use: one excluded freight costs, another deducted rebates paid at year end, and a third used standard rather than actual product costs. Each had been built in good faith by a different team, and each produced a figure that its authors defended.
The company responded by creating a small governance group with representatives from finance, sales and operations. The group agreed official definitions of a dozen key measures, published them in a glossary, and built certified datasets that calculated them consistently. User-built reports on certified data were marked with a badge. Reports unused for six months were archived. Within another year, disputes over figures had largely ended, and users continued to build their own analyses, now on a shared foundation. The central team, no longer occupied with routine report requests, spent its time improving the certified datasets and helping users with more demanding analyses, such as customer profitability and demand forecasting.
Conclusion
Self-service business intelligence fulfils a long-standing ambition: putting data directly in the hands of the people who make decisions. Its benefits, speed, relevance and a stronger analytical culture, are real. So are its risks: conflicting numbers, hidden errors, sprawl and exposure of sensitive data. The organisations that gain most combine freedom for users with governance of the data beneath them: clear ownership, certified datasets, shared definitions, training and regular review. Self-service works best not as the absence of control, but as a well-designed division of responsibility.
References
Abraham, R., Schneider, J., & vom Brocke, J. (2019). Data governance: A conceptual framework, structured review, and research agenda. International Journal of Information Management, 49, 424–438. https://doi.org/10.1016/j.ijinfomgt.2019.07.008
Alpar, P., & Schulz, M. (2016). Self-service business intelligence. Business & Information Systems Engineering, 58(2), 151–155. https://doi.org/10.1007/s12599-016-0424-6
DAMA International. (2017). DAMA-DMBOK: Data management body of knowledge (2nd ed.). Technics Publications.
Davenport, T. H., & Harris, J. G. (2007). Competing on analytics: The new science of winning. Harvard Business School Press.
Few, S. (2006). Information dashboard design: The effective visual communication of data. O'Reilly Media.
Herndon, T., Ash, M., & Pollin, R. (2014). Does high public debt consistently stifle economic growth? A critique of Reinhart and Rogoff. Cambridge Journal of Economics, 38(2), 257–279. https://doi.org/10.1093/cje/bet075
Imhoff, C., & White, C. (2011). Self-service business intelligence: Empowering users to generate insights (TDWI Best Practices Report). The Data Warehousing Institute.
Khatri, V., & Brown, C. V. (2010). Designing data governance. Communications of the ACM, 53(1), 148–152. https://doi.org/10.1145/1629175.1629210
LaValle, S., Lesser, E., Shockley, R., Hopkins, M. S., & Kruschwitz, N. (2011). Big data, analytics and the path from insights to value. MIT Sloan Management Review, 52(2), 21–32.
Otto, B. (2011). Organizing data governance: Findings from the telecommunications industry and consequences for large service providers. Communications of the Association for Information Systems, 29, 45–66. https://doi.org/10.17705/1CAIS.02903
Panko, R. R. (1998). What we know about spreadsheet errors. Journal of End User Computing, 10(2), 15–21.
Popovič, A., Hackney, R., Coelho, P. S., & Jaklič, J. (2012). Towards business intelligence systems success: Effects of maturity and culture on analytical decision making. Decision Support Systems, 54(1), 729–739. https://doi.org/10.1016/j.dss.2012.08.017
Wang, R. Y., & Strong, D. M. (1996). Beyond accuracy: What data quality means to data consumers. Journal of Management Information Systems, 12(4), 5–33. https://doi.org/10.1080/07421222.1996.11518099
Watson, H. J., & Wixom, B. H. (2007). The current state of business intelligence. Computer, 40(9), 96–99. https://doi.org/10.1109/MC.2007.331
Watson, H. J. (2009). Tutorial: Business intelligence – Past, present, and future. Communications of the Association for Information Systems, 25, 487–510. https://doi.org/10.17705/1CAIS.02539
Weber, K., Otto, B., & Österle, H. (2009). One size does not fit all—A contingency approach to data governance. Journal of Data and Information Quality, 1(1), Article 4. https://doi.org/10.1145/1515693.1515696
Wixom, B., & Watson, H. (2010). The BI-based organization. International Journal of Business Intelligence Research, 1(1), 13–28. https://doi.org/10.4018/jbir.2010071702
Yeoh, W., & Koronios, A. (2010). Critical success factors for business intelligence systems. Journal of Computer Information Systems, 50(3), 23–32. https://doi.org/10.1080/08874417.2010.11645404