
Intelligence · Business intelligence
"Business Intelligence: Systems, Processes and Value"
Business intelligence is the set of systems and practices that turn an organisation's data into knowledge for decisions. This article explains where the idea came from, how a business intelligence system is built, what research shows about the value it creates, and why many investments fail to deliver it.
Every organisation generates data as it works. Each sale, invoice, delivery, support call and website visit leaves a record. Most of those records are created to run the business: to bill a customer, ship an order or pay a supplier. Business intelligence, usually shortened to BI, is the effort to use the same records for a different purpose: to understand how the business is performing and to make better decisions about it. It combines technology, such as databases and reporting tools, with processes and people who know how to ask good questions of the data and act on the answers.
Business intelligence has become one of the largest areas of corporate information technology spending. Yet research and experience show that many BI investments deliver far less than they promise. This article explains what business intelligence is, how BI systems are structured, how they create value and why that value so often fails to materialise.
Origins of the idea
The term was introduced by Hans Peter Luhn, a researcher at IBM, in 1958. Luhn (1958) described a system that would automatically abstract and index documents and route them to the people in an organisation who needed them, based on profiles of their interests. Luhn defined intelligence, in this context, as "the ability to apprehend the interrelationships of presented facts in such a way as to guide action towards a desired goal." The definition still captures the essential point: business intelligence is not the data itself but the understanding that guides action.
Luhn's vision was ahead of the technology of the time. Over the following decades, organisations built decision support systems to help managers analyse specific problems, and executive information systems to give senior managers summary views of performance. Watson (2009) traces how these strands converged in the 1990s, when the term business intelligence was popularised as an umbrella for the tools and practices that collect, store, analyse and present business data. Negash (2004) describes BI systems as combining data gathering, data storage and knowledge management with analytical tools to present complex internal and competitive information to planners and decision-makers.
Chen et al. (2012) describe three broad phases. In the first, BI rested on structured data from internal systems, stored in relational databases and data warehouses and analysed through reports and queries. In the second, the growth of the web added unstructured text, clickstreams and user-generated content. In the third, mobile devices and sensors added location and real-time data. Each phase added new sources and techniques without replacing the earlier ones.
What a business intelligence system contains
Watson and Wixom (2007) divide BI into two broad activities: getting data in and getting data out. Getting data in means extracting data from the systems that run the business, cleaning and integrating it, and storing it in a form suitable for analysis. Getting data out means giving people the means to query, analyse and view that data. Both are needed, and the first is usually far more difficult and expensive than users realise.
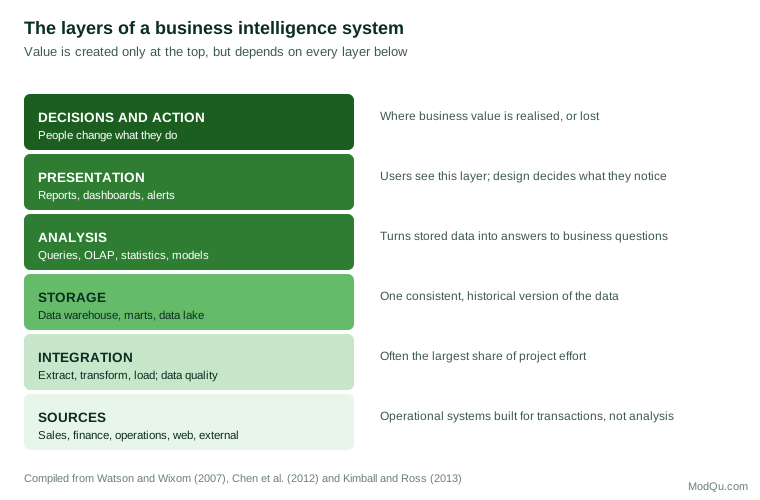
A BI system can be pictured as a set of layers, as shown in Figure 1.
Sources
The raw material comes from operational systems: sales and order processing, finance, inventory, human resources, customer relationship management, websites and, increasingly, external data such as market research, economic indicators and social media. These systems are designed to process transactions quickly and reliably, not to support analysis. They often define the same thing differently: one system's "customer" may be another's "account", and a product may carry different codes in different systems.
Integration
Integration brings data from these sources together. The traditional process is known as extract, transform and load (ETL): data are extracted from source systems, transformed into consistent formats and definitions, and loaded into an analytical store. This layer is where data quality problems are found and, ideally, fixed. Duplicates are merged, missing values identified and conflicting definitions reconciled. Integration is unglamorous but critical, and in many projects it consumes the largest share of time and budget.
Storage
The classic analytical store is the data warehouse. Inmon (2005) defined it as a subject-oriented, integrated, time-variant and non-volatile collection of data supporting management decisions. Subject-oriented means organised around business subjects such as customers and products rather than around applications; integrated means consistent across sources; time-variant means keeping history so that trends can be analysed; non-volatile means that data are added rather than overwritten.
Kimball and Ross (2013) developed an influential approach to designing warehouses around dimensional models. Business events, such as sales, are stored in fact tables, surrounded by dimension tables describing the who, what, where and when of each event. This design makes it straightforward for users and tools to ask questions such as "sales by region by month by product line". In recent years, many organisations have added data lakes, which store large volumes of raw data in its original form, to complement the structured warehouse.
Analysis
The analysis layer turns stored data into answers. It ranges from simple queries and standard reports to online analytical processing (OLAP), a term introduced by Codd et al. (1993) for tools that let users explore multidimensional data interactively, drilling down from totals to details and slicing data by different dimensions. Chaudhuri and Dayal (1997) describe how warehouses and OLAP tools were designed together to support such exploration efficiently. More advanced analysis applies statistics, forecasting and machine learning, a field often described as business analytics.
Presentation
The presentation layer delivers results to users through reports, dashboards, alerts and, increasingly, embedded displays within operational applications. Few (2006) argues that the design of this layer matters greatly: a well-designed dashboard lets a manager see at a glance what needs attention, while a poorly designed one buries important signals among decoration and irrelevant detail.
Decisions and action
The top layer is not technology at all. It is the set of decisions and actions that BI is meant to improve. If managers look at a dashboard and then decide exactly as they would have without it, the system has produced no value, however sophisticated the layers beneath.
Business intelligence as a process
Treating BI as a technology project is one of the most common causes of failure. Wixom and Watson (2010) describe the most successful BI users as "BI-based organisations", in which business intelligence is embedded in how decisions are made, supported by executive sponsorship, a culture of using facts, and close partnership between business and technical staff. In such organisations BI is a continuing process rather than a system installed once.
That process resembles the intelligence cycle used in government. It begins with requirements: which decisions need support, and what information would improve them? It continues with collection and integration of the relevant data, analysis to find patterns and answer questions, and dissemination of results to the people who decide. It ends, or should end, with feedback: did the information help, and what should change? Organisations that skip the first and last steps often build systems that answer questions nobody asked.
Davenport (2006) studied companies that had made analytics central to their strategy, which Davenport called analytics competitors. They used data not only to report on the past but to optimise pricing, supply chains, customer service and marketing. Davenport and Harris (2007) found that such companies shared certain features: senior leaders committed to fact-based decision-making, enterprise-wide approaches to data rather than isolated departmental systems, and significant investment in analytical skills.
Does business intelligence create value?
The case for BI rests on the claim that better information leads to better decisions, and better decisions to better performance. Research supports the claim, but with important conditions.
Evidence of benefits
McAfee and Brynjolfsson (2012), surveying large American companies, found that those describing themselves as most data-driven were on average about 5% more productive and 6% more profitable than their competitors. Brynjolfsson and McElheran (2016), using census data on American manufacturing plants, documented a rapid spread of data-driven decision-making and found that its adoption was associated with higher productivity. Provost and Fawcett (2013) argue that data-driven decision-making, as a practice, is distinct from the technologies that support it, and that its benefits come from changing how decisions are made.
Elbashir et al. (2008) studied the effects of BI systems in Australian organisations. They found that benefits appeared first at the level of business processes, such as better supplier relationships, more efficient internal operations and better customer intelligence, and that these process benefits then contributed to organisational performance. In other words, BI improves performance indirectly, through better work, not directly.
Conditions for value
Trieu (2017), reviewing a large body of research, describes BI value as the result of a chain: investment in BI creates BI assets; those assets, if used appropriately, have impacts on business processes; and those impacts, under favourable competitive conditions, improve organisational performance. Each link can fail. An organisation can invest without creating usable assets; it can create assets that are not used; and it can use them without improving anything that matters.
Popovič et al. (2012) studied what makes BI systems successful in practice. They found that more mature BI systems improved the quality of information available, but that information quality improved decision-making only where the organisation had an analytical decision-making culture, one in which people were expected to use information when making decisions. Technology alone was not enough.
Sharma et al. (2014) reached a similar conclusion from a different direction. They argued that the link between analytics and value runs through decision-making processes: insights produce value only when they change the decisions people make, and organisations must deliberately redesign those processes to absorb new information.
Why projects fail
Yeoh and Koronios (2010), studying BI implementations, found that organisational factors, such as committed management support, a clear business vision and a champion within the business, mattered more to success than technical factors. Among technical factors, data quality and the integration of source systems were most important.
LaValle et al. (2011), surveying thousands of executives, found that the leading obstacle to wider use of analytics was not data or technology but management and culture: lack of understanding of how to use analytics to improve the business, lack of management bandwidth and an absence of skills. Top-performing organisations were more likely to use analytics across a wide range of decisions, from strategy to day-to-day operations.
Several common failure patterns emerge from this literature:
- Technology first. The organisation buys tools before deciding which decisions they should support.
- Poor data. Integration is underestimated, and users lose trust when reports contradict each other or show obvious errors. Redman (1998) documented how poor data quality imposes costs on typical enterprises, from operational errors to poor decisions and lost trust.
- Report proliferation. Hundreds of reports are produced, few are read and none is clearly owned.
- No change in decisions. Information is delivered but decision processes stay the same, so nothing improves.
- Distrust of analysis. Managers override analytical findings with intuition, sometimes for good reasons and sometimes not. Dietvorst et al. (2015) showed that people often lose confidence in an algorithm after seeing it make an error, even when it outperforms human judgement, a tendency they called algorithm aversion.
Data quality and governance
Because every layer of a BI system depends on the data beneath it, data quality is a constant concern. Wang and Strong (1996), surveying data users, found that people judge data quality by much more than accuracy. They also care whether data are relevant, timely, complete, easy to interpret, consistently represented and accessible. Data can be accurate and still useless if they arrive too late or cannot be understood.
Maintaining quality requires data governance: clear decision rights and accountability for data. Khatri and Brown (2010) identify five decision domains for governance: data principles, data quality, metadata, data access and data lifecycle. Each needs owners who decide, for example, the official definition of a customer, the acceptable error rate in product data or who may see salary information. Without governance, different departments maintain their own versions of the truth, and BI reports multiply contradictions instead of resolving them.
People and roles
Business intelligence depends on several kinds of people, and gaps in any of them weaken the whole. Data engineers build and maintain the integration pipelines and analytical stores. Data stewards, usually in business departments, own the definitions and quality of particular data, such as customer or product records. Analysts translate business questions into queries and models and interpret the results. Business users, from front-line supervisors to executives, consume reports and act on them. A sponsor, typically a senior executive, sets priorities and secures funding.
Many organisations also create a BI competency centre or centre of excellence: a small team that sets standards, maintains shared data definitions, trains users and decides which requests to prioritise. Wixom and Watson (2010) note that the most successful organisations balance central control, which keeps data consistent, with local flexibility, which keeps BI responsive to business needs.
The most scarce skill is often translation: the ability to understand both the business problem and the data well enough to connect them. Analysts who sit close to the business, attend its meetings and understand its pressures produce work that is far more likely to be used than analysts who receive requests through a ticketing system.
Changing technology, constant principles
The technology of business intelligence changes quickly. Cloud data platforms have reduced the cost of storing and processing data; self-service tools let business users build their own reports; machine learning automates some analysis; and natural-language interfaces let users ask questions in plain words. Chen et al. (2012) anticipated much of this expansion in sources and techniques.
These changes make some tasks easier, but they do not change the principles described in this article. More data and easier tools can just as easily multiply inconsistent reports and unused dashboards as improve decisions. The organisations that benefit most continue to start from decisions, invest in data quality and governance, and build the culture and processes that turn information into action.
Building value from business intelligence
The research suggests a set of practical principles for organisations seeking value from BI:
- Start with decisions. Identify the decisions that matter most to the business, and the information that would improve them, before choosing technology.
- Invest in data foundations. Integration, quality and governance are the least visible parts of BI and the most important.
- Design for use. Reports and dashboards should be designed around how people actually work, showing what needs attention and little else.
- Build analytical culture. Leaders should ask for evidence, use it visibly and reward people who do the same. Without such a culture, even excellent systems go unused (Popovič et al., 2012).
- Change processes, not just information. Where BI reveals better ways to decide, redesign the decision process to use them.
- Measure value. Track which reports and analyses are used, which decisions they influenced and with what results, and retire what is not used.
An illustration
Consider a regional chain of hardware stores. Its managers receive weekly sales reports by store and department, produced manually from the point-of-sale system. The reports are late, and figures sometimes disagree with the finance system. Managers rely mostly on their experience.
The company decides to build a BI system. A technology-first approach would buy a dashboard tool and connect it to the existing data. A value-first approach starts differently. It asks which decisions matter most: perhaps stock allocation between stores, seasonal ordering and pricing of high-volume items. For each, it identifies the information needed: sales by item, store and week; stock levels; supplier lead times; competitor prices. It then builds integrated, governed data for those needs, and dashboards that show store managers exactly which items are running low or overstocked, with suggested actions.
Six months later, the company measures results: fewer stock-outs of top-selling items, lower excess inventory at season end, and faster reactions to competitor price changes. Those measurable improvements in decisions, not the dashboards themselves, are the value of business intelligence. The company also learns what did not work. A detailed margin report requested by the finance team is opened by almost no one, so it is replaced by a short monthly summary. Store managers ask for a simple daily list of items to reorder rather than an interactive dashboard, because they have little time to explore data during the working day. Such adjustments, guided by evidence of use, are part of the continuing BI process.
Conclusion
Business intelligence turns operational data into knowledge for decisions. Its systems span sources, integration, storage, analysis and presentation, but its value appears only when people decide and act differently. Research shows that BI can improve performance substantially, but the benefits depend less on technology than on clear purpose, trustworthy data, an analytical culture and decision processes designed to use what the data reveal. Luhn's definition from 1958 remains the best test: a business intelligence system succeeds only when it helps people understand the relationships among facts well enough to guide action towards their goals.
References
Brynjolfsson, E., & McElheran, K. (2016). The rapid adoption of data-driven decision-making. American Economic Review, 106(5), 133–139. https://doi.org/10.1257/aer.p20161016
Chaudhuri, S., & Dayal, U. (1997). An overview of data warehousing and OLAP technology. ACM SIGMOD Record, 26(1), 65–74. https://doi.org/10.1145/248603.248616
Chen, H., Chiang, R. H. L., & Storey, V. C. (2012). Business intelligence and analytics: From big data to big impact. MIS Quarterly, 36(4), 1165–1188. https://doi.org/10.2307/41703503
Codd, E. F., Codd, S. B., & Salley, C. T. (1993). Providing OLAP (on-line analytical processing) to user-analysts: An IT mandate. Codd & Date.
Davenport, T. H., & Harris, J. G. (2007). Competing on analytics: The new science of winning. Harvard Business School Press.
Davenport, T. H. (2006). Competing on analytics. Harvard Business Review, 84(1), 98–107.
Dietvorst, B. J., Simmons, J. P., & Massey, C. (2015). Algorithm aversion: People erroneously avoid algorithms after seeing them err. Journal of Experimental Psychology: General, 144(1), 114–126. https://doi.org/10.1037/xge0000033
Elbashir, M. Z., Collier, P. A., & Davern, M. J. (2008). Measuring the effects of business intelligence systems: The relationship between business process and organizational performance. International Journal of Accounting Information Systems, 9(3), 135–153. https://doi.org/10.1016/j.accinf.2008.03.001
Few, S. (2006). Information dashboard design: The effective visual communication of data. O'Reilly Media.
Inmon, W. H. (2005). Building the data warehouse (4th ed.). Wiley.
Khatri, V., & Brown, C. V. (2010). Designing data governance. Communications of the ACM, 53(1), 148–152. https://doi.org/10.1145/1629175.1629210
Kimball, R., & Ross, M. (2013). The data warehouse toolkit: The definitive guide to dimensional modeling (3rd ed.). Wiley.
LaValle, S., Lesser, E., Shockley, R., Hopkins, M. S., & Kruschwitz, N. (2011). Big data, analytics and the path from insights to value. MIT Sloan Management Review, 52(2), 21–32.
Luhn, H. P. (1958). A business intelligence system. IBM Journal of Research and Development, 2(4), 314–319. https://doi.org/10.1147/rd.24.0314
McAfee, A., & Brynjolfsson, E. (2012). Big data: The management revolution. Harvard Business Review, 90(10), 60–68.
Negash, S. (2004). Business intelligence. Communications of the Association for Information Systems, 13, 177–195. https://doi.org/10.17705/1CAIS.01315
Popovič, A., Hackney, R., Coelho, P. S., & Jaklič, J. (2012). Towards business intelligence systems success: Effects of maturity and culture on analytical decision making. Decision Support Systems, 54(1), 729–739. https://doi.org/10.1016/j.dss.2012.08.017
Provost, F., & Fawcett, T. (2013). Data science and its relationship to big data and data-driven decision making. Big Data, 1(1), 51–59. https://doi.org/10.1089/big.2013.1508
Redman, T. C. (1998). The impact of poor data quality on the typical enterprise. Communications of the ACM, 41(2), 79–82. https://doi.org/10.1145/269012.269025
Sharma, R., Mithas, S., & Kankanhalli, A. (2014). Transforming decision-making processes: A research agenda for understanding the impact of business analytics on organisations. European Journal of Information Systems, 23(4), 433–441. https://doi.org/10.1057/ejis.2014.17
Trieu, V.-H. (2017). Getting value from business intelligence systems: A review and research agenda. Decision Support Systems, 93, 111–124. https://doi.org/10.1016/j.dss.2016.09.019
Wang, R. Y., & Strong, D. M. (1996). Beyond accuracy: What data quality means to data consumers. Journal of Management Information Systems, 12(4), 5–33. https://doi.org/10.1080/07421222.1996.11518099
Watson, H. J., & Wixom, B. H. (2007). The current state of business intelligence. Computer, 40(9), 96–99. https://doi.org/10.1109/MC.2007.331
Watson, H. J. (2009). Tutorial: Business intelligence – Past, present, and future. Communications of the Association for Information Systems, 25, 487–510. https://doi.org/10.17705/1CAIS.02539
Wixom, B., & Watson, H. (2010). The BI-based organization. International Journal of Business Intelligence Research, 1(1), 13–28. https://doi.org/10.4018/jbir.2010071702
Yeoh, W., & Koronios, A. (2010). Critical success factors for business intelligence systems. Journal of Computer Information Systems, 50(3), 23–32. https://doi.org/10.1080/08874417.2010.11645404