
Intelligence · Business intelligence
Dashboards That Inform Decisions Rather Than Decorate Them
Many dashboards look impressive but change nothing. This article explains what dashboards are for, what research on visual perception says about designing them, the most common design mistakes and a practical method for building dashboards that support real decisions.
The dashboard has become the public face of business intelligence. Executives expect one; software vendors compete on how attractive theirs look; and many organisations have more dashboards than anyone can remember. Yet a large share of them are rarely opened, and many of those that are opened do little to change what anyone does. A dashboard full of dials, colourful pie charts and flashing indicators can look like intelligence while conveying very little.
This article explains what dashboards are for, what research on visual perception says about designing them, and how to build dashboards that inform decisions rather than decorate meetings.
What a dashboard is for
Few (2006) defines a dashboard as a visual display of the most important information needed to achieve one or more objectives, consolidated and arranged on a single screen so that it can be monitored at a glance. Three parts of that definition matter. A dashboard shows the most important information, not all available information. It serves objectives, so it should be designed around a purpose. And it is meant to be monitored at a glance, so its design must let the viewer see quickly whether anything needs attention.
Yigitbasioglu and Velcu (2012), reviewing research on dashboards in performance management, distinguish several purposes: monitoring performance against targets, supporting consistency in how measures are defined and used, planning, and communication. A dashboard designed for one purpose may serve another poorly. Sarikaya et al. (2019), analysing a large collection of real dashboards, found great variety in purpose, audience and design, from static operational displays to interactive tools for analysis and from displays for a single decision-maker to public information screens. They argued that designers should be explicit about which kind of dashboard they are building.
Pauwels et al. (2009), writing about marketing dashboards, emphasise that a dashboard should connect a small number of key metrics to the outcomes the organisation cares about, showing how marketing actions drive business results, rather than reporting every available measure. This echoes the logic of the balanced scorecard (Kaplan & Norton, 1992): measures should be chosen because they tell the story of how the organisation succeeds.
The limits of attention
Dashboards are bounded by human perception and memory. Miller (1956) showed that people can hold only a small number of items in working memory at once, and later research has suggested the practical limit is smaller still. Eppler and Mengis (2004) found that beyond a certain amount of information, decision quality declines as people become overwhelmed. A dashboard with forty indicators asks more of its users than they can give.
Endsley (1995) describes situation awareness as having three levels: perceiving the relevant elements of a situation, understanding what they mean, and projecting what will happen next. A good dashboard supports all three. It makes important changes easy to notice, provides the context needed to interpret them and, where possible, shows trends or forecasts that help users anticipate.
What perception research teaches
Some ways of displaying numbers are read much more accurately than others. Cleveland and McGill (1984) tested how accurately people judged quantities encoded in different ways. Judgements based on position along a common scale, as in a bar chart or dot plot, were the most accurate. Judgements based on length, angle, area and colour intensity were progressively less accurate. Figure 1 summarises the ordering.
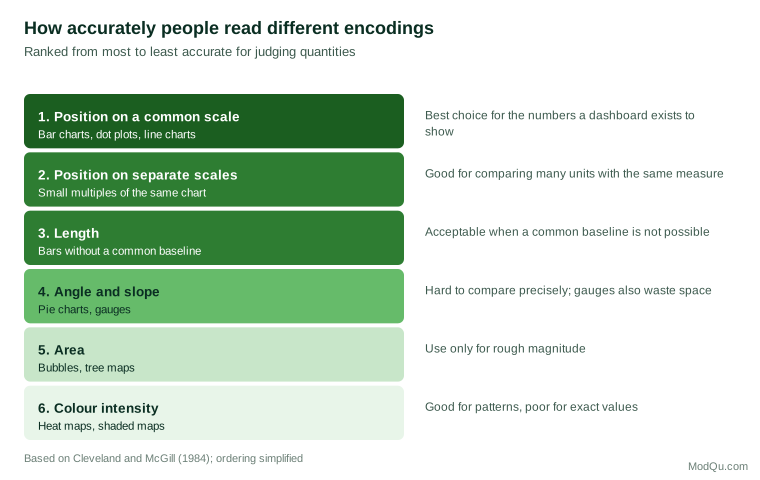
The practical implications are direct. Bar charts and line charts should carry the most important comparisons. Pie charts, gauges and bubble charts make precise comparison harder. Colour is better used to draw attention, for example to a value outside its acceptable range, than to encode quantities.
Ware (2012) explains that some visual features, such as a distinct colour, size or orientation, are noticed almost instantly, before conscious attention. Designers can use these features to make exceptions stand out. The corollary is that if everything on a dashboard is brightly coloured, nothing stands out. Munzner (2014) provides a systematic framework for matching visual encodings to the type of data and the task the viewer must perform, reinforcing the principle that design choices should follow from purpose.
Tufte (1983) argued that good graphics maximise the share of ink devoted to data and remove decoration that conveys nothing, which Tufte called "chartjunk". Three-dimensional effects, heavy borders, background images and ornamental gauges all fall into this category. Knaflic (2015) applies the same principles to business communication, recommending that designers remove clutter, use colour sparingly and lead the viewer's eye to what matters.
Common mistakes
Few (2006) catalogues the mistakes that most often undermine dashboards. Several recur in practice:
- Too much information. The dashboard includes every available metric, so the important ones are lost.
- No context. A number appears without comparison to a target, trend or prior period, so the viewer cannot tell whether it is good or bad.
- Poor chart choices. Gauges, pie charts and three-dimensional charts are used where a simple bar or line would be clearer.
- Decoration. Logos, gradients, shadows and ornamental frames take space and attention away from the data.
- Overuse of colour. Red and green are applied to everything, so nothing stands out, and colour-blind users cannot distinguish the alerts.
- Comparable measures crowd out distinctive ones. Lipe and Salterio (2000) found that managers evaluating business units with scorecards relied on measures shared by all units and largely ignored measures specific to each unit. On a dashboard, the same tendency means that a standard grid of common measures can overshadow the one indicator that matters most for a particular team.
- Spread across screens. Users must scroll or click between pages to see related information, losing the ability to take in the situation at a glance.
Separating signal from noise
A subtler problem is overreaction. Every measure fluctuates from period to period. Shewhart (1931) distinguished routine variation, inherent in any process, from variation that signals a real change. A dashboard that shows a red arrow whenever a figure falls below last week's level will trigger alarms that are mostly noise. Showing a trend line with the normal range of variation lets users see when a change is genuinely unusual. Parmenter (2015) recommends that indicators be reviewed at a frequency suited to how quickly action can be taken; daily alerts on a measure that can only be influenced quarterly invite wasted effort.
A method for building useful dashboards
The following steps reflect the research and practitioner guidance summarised above.
- Name the user and the decision. Who will use this dashboard, how often, and which decisions should it inform? A store manager deciding on daily staffing needs a different dashboard from a chief executive reviewing quarterly strategy.
- Choose few measures. Select the handful of measures that most directly inform those decisions. Move everything else to supporting reports.
- Provide context for every number. Show each measure against a target, a trend or a comparison so that the viewer can judge it.
- Use the most accurate encodings. Prefer position and length; use colour mainly to highlight exceptions.
- Design for the glance. Place the most important information at the top left, where readers of left-to-right languages look first, and keep everything on one screen.
- Make exceptions stand out. Reserve strong colour and emphasis for values that need action.
- Test with users. Watch real users read the dashboard and ask what they would do in response. If they cannot say, redesign.
- Track use and retire what is unused. Usage statistics show which dashboards matter. Unused dashboards consume maintenance effort and clutter the landscape.
An example
A regional manager of a chain of clinics receives a dashboard with twenty gauges, each showing one clinic's patient satisfaction score, colour-coded red, amber or green. The gauges take up the whole screen, and the colours change almost every week. The manager learns to ignore them.
A redesign replaces the gauges with a single sorted bar chart showing all twenty clinics' scores, a vertical line marking the target and a small line chart beside each bar showing the past year's trend. Clinics whose scores have fallen outside their normal range are highlighted in one strong colour. The manager can now see at a glance which clinics are below target, which are improving or declining, and which have changed significantly enough to justify a call. The same data, presented differently, now supports a decision. The redesign also prompts a useful conversation: two clinics that had been flagged red almost every week turn out to have stable scores slightly below target, which calls for a longer-term improvement plan rather than weekly alarms.
Conclusion
Dashboards are valuable when they help people see what needs attention and decide what to do. That requires choosing a small number of measures tied to real decisions, presenting them with context, using visual encodings that people read accurately, and removing everything that distracts. Research on perception and attention provides clear guidance; most failures come from ignoring it in favour of decoration. The test of a dashboard is not how impressive it looks but whether its users act differently, and better, because of it.
References
Cleveland, W. S., & McGill, R. (1984). Graphical perception: Theory, experimentation, and application to the development of graphical methods. Journal of the American Statistical Association, 79(387), 531–554. https://doi.org/10.1080/01621459.1984.10478080
Endsley, M. R. (1995). Toward a theory of situation awareness in dynamic systems. Human Factors, 37(1), 32–64. https://doi.org/10.1518/001872095779049543
Eppler, M. J., & Mengis, J. (2004). The concept of information overload: A review of literature from organization science, accounting, marketing, MIS, and related disciplines. The Information Society, 20(5), 325–344. https://doi.org/10.1080/01972240490507974
Few, S. (2006). Information dashboard design: The effective visual communication of data. O'Reilly Media.
Kaplan, R. S., & Norton, D. P. (1992). The balanced scorecard: Measures that drive performance. Harvard Business Review, 70(1), 71–79.
Knaflic, C. N. (2015). Storytelling with data: A data visualization guide for business professionals. Wiley.
Lipe, M. G., & Salterio, S. E. (2000). The balanced scorecard: Judgmental effects of common and unique performance measures. The Accounting Review, 75(3), 283–298. https://doi.org/10.2308/accr.2000.75.3.283
Miller, G. A. (1956). The magical number seven, plus or minus two: Some limits on our capacity for processing information. Psychological Review, 63(2), 81–97. https://doi.org/10.1037/h0043158
Munzner, T. (2014). Visualization analysis and design. CRC Press.
Parmenter, D. (2015). Key performance indicators: Developing, implementing, and using winning KPIs (3rd ed.). Wiley.
Pauwels, K., Ambler, T., Clark, B. H., LaPointe, P., Reibstein, D., Skiera, B., Wierenga, B., & Wiesel, T. (2009). Dashboards as a service: Why, what, how, and what research is needed? Journal of Service Research, 12(2), 175–189. https://doi.org/10.1177/1094670509344213
Sarikaya, A., Correll, M., Bartram, L., Tory, M., & Fisher, D. (2019). What do we talk about when we talk about dashboards? IEEE Transactions on Visualization and Computer Graphics, 25(1), 682–692. https://doi.org/10.1109/TVCG.2018.2864903
Shewhart, W. A. (1931). Economic control of quality of manufactured product. Van Nostrand.
Tufte, E. R. (1983). The visual display of quantitative information. Graphics Press.
Ware, C. (2012). Information visualization: Perception for design (3rd ed.). Morgan Kaufmann.
Yigitbasioglu, O. M., & Velcu, O. (2012). A review of dashboards in performance management: Implications for design and research. International Journal of Accounting Information Systems, 13(1), 41–59. https://doi.org/10.1016/j.accinf.2011.08.002