
Insights · Communicating insight
Visualising Insights for Different Audiences
How to choose and design charts for executives, managers, analysts and the public, drawing on research on graphical perception, graph literacy, numeracy and uncertainty, with practical guidance on chart choice, colour, annotation and showing uncertainty.
A chart that works perfectly for an analyst may baffle a board member, and a chart designed for the board may frustrate the analyst who wants to check the detail. Visualising insight is not only a matter of choosing the right chart for the data. It is also a matter of choosing the right chart for the people who will read it: what they need to decide, how much time they have, how familiar they are with charts and numbers, and how they will use what they see. This article reviews what research says about how people read charts and how that varies, and sets out practical guidance for visualising insight for different audiences.
How people read charts
Some ways of encoding data are read more accurately than others. Cleveland and McGill (1984) ran experiments in which people judged the relative sizes of values shown in different ways and found a consistent ranking. Position along a common scale, as in a bar or dot chart, was read most accurately, followed by position along non-aligned scales, length, angle and slope, area, and finally volume and colour intensity. Heer and Bostock (2010) replicated these experiments with a large online sample and obtained a broadly similar ranking.
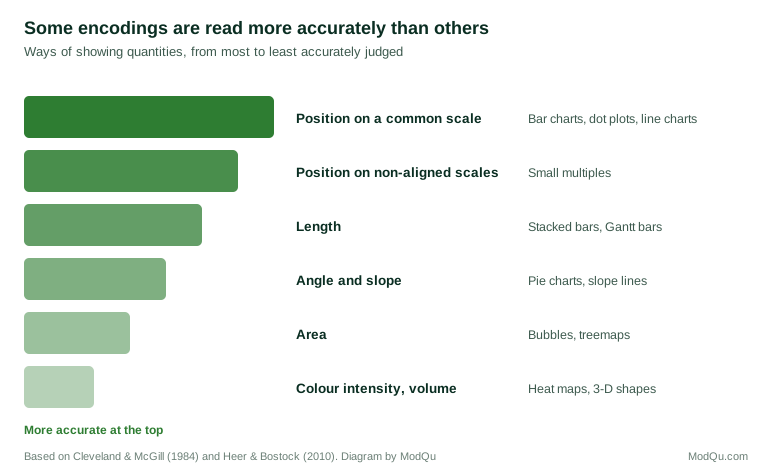
The practical lesson is that when accurate comparison matters, values should be shown by position or length: bar charts, dot plots and line charts. Pie charts, bubble charts and colour scales are harder to read precisely. They can still be useful, for example to show that one part dominates a whole, but they should not be used where readers need to compare similar values.
Kosslyn (2006) set out principles for graph design based on how the visual system and memory work, including that a display should contain no more information than the reader needs, that different elements should be visibly different, and that the reader's attention should be drawn to the most important parts. Ware (2013) explained how some visual features, such as colour, size and orientation, are processed by the visual system almost immediately and before conscious attention. A single highlighted bar among grey ones is found instantly; a particular value in a table must be searched for.
Even the way a chart frames its message shapes what people remember. Kong et al. (2018) found that the titles of charts influenced what readers recalled and concluded from them, especially when the title emphasised one side of the data.
Audiences differ
In graph literacy and numeracy
People differ greatly in their ability to read charts and to work with numbers. Galesic and Garcia-Retamero (2011) developed a test of graph literacy and found substantial variation in samples from Germany and the United States, with many people struggling to read basic charts. Lipkus et al. (2001) found that even highly educated people often made errors on simple numeracy questions involving percentages and probabilities. Peters et al. (2006) found that people with lower numeracy were more influenced by how numbers were framed and less able to draw meaning from them.
These differences affect how people use charts. Okan et al. (2012) found that people with higher graph literacy were better able to use visual displays to understand risks, while those with lower graph literacy benefited much less from the same displays. Garcia-Retamero and Cokely (2017) reviewed research on visual aids for communicating risk and concluded that well-designed visual aids help people across levels of numeracy, but that their design needs to take account of the audience's skills. They recommended simple formats, such as icon arrays showing frequencies out of a common total.
Format matters for numbers as well as charts. Gigerenzer and Hoffrage (1995) found that people reasoned much more accurately about probabilities when information was presented as natural frequencies ("8 out of 1,000") than as percentages or conditional probabilities.
Executives and other non-specialist audiences should not be assumed to have low graph literacy. But they should not be assumed to share the analyst's familiarity with particular chart types, statistical terms or the data being shown.
In what they need
Different audiences need different things from a visualisation. Shneiderman (1996) summarised the needs of users exploring data as "overview first, zoom and filter, then details on demand". Different audiences tend to stop at different points in that sequence.
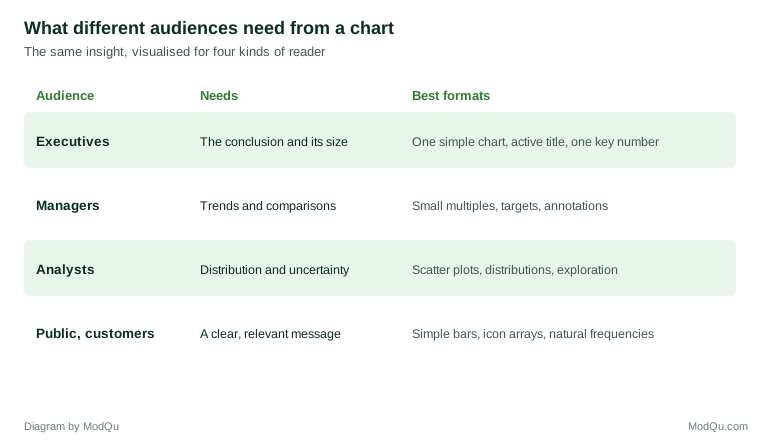
Executives need the conclusion, its size and its implications. They benefit most from a small number of simple charts, each making one point stated in its title, with detail available in an appendix.
Managers need to monitor their area and compare it with targets, periods and other units. Few (2006) argued that dashboards should be designed so that the most important information can be taken in at a glance, using simple, compact displays and avoiding decoration. Small multiples, a series of small charts with the same scale, allow quick comparison across units.
Analysts need to see the full shape of the data, including its distribution, outliers and uncertainty, and often to explore it interactively. Munzner (2014) set out a framework for designing visualisations based on the question of what the user needs to do with the data, which helps decide what to show to this audience.
The public and customers need clear messages relevant to them, presented in formats that require little specialist skill: simple bar charts, icon arrays and natural frequencies rather than complex charts and percentages.
Showing uncertainty to different audiences
Uncertainty is often the first casualty of simplification. It should not be. But the usual ways of showing it are poorly understood. Belia et al. (2005) found that many researchers in psychology, behavioural neuroscience and medicine misinterpreted error bars, confusing confidence intervals with standard errors and misjudging what overlapping bars meant. Correll and Gleicher (2014) found that bar charts with error bars led viewers to judge values within the bar as more likely than values just above it, even though the error bar was symmetrical, and that alternative encodings, such as gradient plots and violin plots, supported more accurate judgements.
Hullman et al. (2015) proposed "hypothetical outcome plots", animations that show a series of possible outcomes drawn from the uncertainty in the data, and found that people using them made more accurate judgements about the reliability of differences than people using error bars or violin plots. Such displays can work well for non-specialist audiences, because they show uncertainty as variation in outcomes rather than as abstract intervals.
For executive audiences, uncertainty can often be conveyed in words alongside the chart: "about 30%, likely between 25% and 35%". For analysts, intervals, distributions and the underlying data should be shown.
Colour
Colour is one of the most powerful tools in visualisation and one of the most misused. Some guidelines apply to all audiences.
- Use colour to highlight, not decorate. Show most of the data in a neutral colour and the important part in a strong one.
- Match the colour scheme to the data. Harrower and Brewer (2003) distinguished sequential schemes for ordered data, diverging schemes for data with a meaningful midpoint, and qualitative schemes for categories, and developed a widely used tool for choosing them.
- Design for colour vision deficiency. Birch (2012) estimated that red–green colour deficiency affects about 8% of men and 0.4% of women of northern European origin. Avoid relying on red and green alone to distinguish important categories; use differences in lightness, labels or patterns as well.
- Be consistent. Use the same colour for the same thing across all charts in a report.
Practical guidance
Several principles help across audiences:
Start with the question. Ask what the audience needs to see to answer their question or make their decision, and choose the chart that shows that most directly.
Prefer position and length. Use bar, dot and line charts for comparisons where accuracy matters.
Give each chart an active title. State what the chart shows, not just what it is about. Knaflic (2015) recommended this as one of the simplest ways to make charts more effective for business audiences.
Annotate. Label key values and events directly on the chart rather than relying on a legend or the audience's interpretation.
Remove clutter. Tufte (2001) argued for maximising the share of a graphic's ink devoted to data, removing gridlines, borders and decoration that do not help.
Make charts memorable when that matters. Borkin et al. (2013) found that features such as colour and recognisable objects made visualisations more memorable. For an audience who will see a chart once, in a presentation, a distinctive visual can help the main point stick.
Layer the detail. Provide a simple version for the main presentation, with more detailed versions in an appendix or interactive tool for those who want them. Segel and Heer (2010) found that many effective narrative visualisations guide readers through a main story before allowing them to explore.
Test the chart. Show it to someone from the intended audience and ask what it tells them. If they cannot state the main point, the chart needs work.
Common mistakes
Several mistakes recur when insight is visualised for audiences other than analysts.
Showing the analysis rather than the finding. A chart that was useful during analysis, such as a correlation matrix or a chart with every segment, is rarely the best way to show a finding to a decision maker.
Too many series. A line chart with ten coloured lines is hard to read for any audience. Highlight the one or two that matter and show the rest in grey, or use small multiples.
Dual axes. Charts with two vertical scales invite readers to compare lines whose relative position depends entirely on how the scales were chosen. Two separate charts are usually clearer.
Truncated or inconsistent scales. Bar charts that do not start at zero exaggerate differences, and charts placed side by side with different scales invite false comparisons.
Unexplained terms. Labels such as "NPS", "CSAT index" or "uplift vs control" may be familiar to analysts but not to the audience. Define them or replace them with plain descriptions.
Decoration that competes with the data. Three-dimensional effects, heavy gridlines and background images make charts harder to read without adding information.
A worked example
Consider a hypothetical insight that customer satisfaction varies widely across a company's 40 stores and that the variation is largely explained by staffing levels.
For the board, a single chart might show the ten highest and ten lowest stores' satisfaction scores alongside their staffing levels, with the title "Stores with more staff per customer have much higher satisfaction" and one key number: the difference in satisfaction between the best- and worst-staffed quarters of stores.
For regional managers, small multiples showing each region's stores, with targets marked and each manager's own stores highlighted, allow them to see where they stand and which stores need attention.
For analysts, a scatter plot of all 40 stores, with satisfaction against staff per customer, a fitted line, confidence band and labels for outliers, lets them judge the strength of the relationship and spot stores that do not fit.
For staff and customers, if the findings are shared, a simple statement such as "In stores with more staff, about 8 in 10 customers are very satisfied, compared with about 5 in 10 in stores with fewer staff" may communicate more than any chart.
The insight is the same in each case. The visualisation is designed around what each audience needs to understand and do.
Key takeaways
People read some visual encodings more accurately than others: position and length best, angle and area less well, colour intensity and volume worst. Audiences differ in graph literacy and numeracy and in what they need, from the conclusion and its size for executives to the full distribution and uncertainty for analysts. Uncertainty should be shown in a form each audience can understand, which may mean words or hypothetical outcomes rather than error bars. Colour should highlight what matters, match the type of data and remain readable for people with colour vision deficiency. Across audiences, start with the question, prefer simple encodings, give each chart an active title, annotate, remove clutter, layer the detail and test the chart on its intended readers.
References
Belia, S., Fidler, F., Williams, J., & Cumming, G. (2005). Researchers misunderstand confidence intervals and standard error bars. Psychological Methods, 10(4), 389–396. https://doi.org/10.1037/1082-989X.10.4.389
Birch, J. (2012). Worldwide prevalence of red-green color deficiency. Journal of the Optical Society of America A, 29(3), 313–320. https://doi.org/10.1364/JOSAA.29.000313
Borkin, M. A., Vo, A. A., Bylinskii, Z., Isola, P., Sunkavalli, S., Oliva, A., & Pfister, H. (2013). What makes a visualization memorable? IEEE Transactions on Visualization and Computer Graphics, 19(12), 2306–2315. https://doi.org/10.1109/TVCG.2013.234
Cleveland, W. S., & McGill, R. (1984). Graphical perception: Theory, experimentation, and application to the development of graphical methods. Journal of the American Statistical Association, 79(387), 531–554. https://doi.org/10.1080/01621459.1984.10478080
Correll, M., & Gleicher, M. (2014). Error bars considered harmful: Exploring alternate encodings for mean and error. IEEE Transactions on Visualization and Computer Graphics, 20(12), 2142–2151. https://doi.org/10.1109/TVCG.2014.2346298
Few, S. (2006). Information dashboard design: The effective visual communication of data. O'Reilly.
Galesic, M., & Garcia-Retamero, R. (2011). Graph literacy: A cross-cultural comparison. Medical Decision Making, 31(3), 444–457. https://doi.org/10.1177/0272989X10373805
Garcia-Retamero, R., & Cokely, E. T. (2017). Designing visual aids that promote risk literacy: A systematic review of health research and evidence-based design heuristics. Human Factors, 59(4), 582–627. https://doi.org/10.1177/0018720817690634
Gigerenzer, G., & Hoffrage, U. (1995). How to improve Bayesian reasoning without instruction: Frequency formats. Psychological Review, 102(4), 684–704. https://doi.org/10.1037/0033-295X.102.4.684
Harrower, M., & Brewer, C. A. (2003). ColorBrewer.org: An online tool for selecting colour schemes for maps. The Cartographic Journal, 40(1), 27–37. https://doi.org/10.1179/000870403235002042
Heer, J., & Bostock, M. (2010). Crowdsourcing graphical perception: Using Mechanical Turk to assess visualization design. In Proceedings of the SIGCHI Conference on Human Factors in Computing Systems (pp. 203–212). ACM. https://doi.org/10.1145/1753326.1753357
Hullman, J., Resnick, P., & Adar, E. (2015). Hypothetical outcome plots outperform error bars and violin plots for inferences about reliability of variable ordering. PLoS ONE, 10(11), Article e0142444. https://doi.org/10.1371/journal.pone.0142444
Knaflic, C. N. (2015). Storytelling with data: A data visualization guide for business professionals. Wiley. https://doi.org/10.1002/9781119055259
Kong, H.-K., Liu, Z., & Karahalios, K. (2018). Frames and slants in titles of visualizations on controversial topics. In Proceedings of the 2018 CHI Conference on Human Factors in Computing Systems (Paper 438). ACM. https://doi.org/10.1145/3173574.3174012
Kosslyn, S. M. (2006). Graph design for the eye and mind. Oxford University Press.
Lipkus, I. M., Samsa, G., & Rimer, B. K. (2001). General performance on a numeracy scale among highly educated samples. Medical Decision Making, 21(1), 37–44. https://doi.org/10.1177/0272989X0102100105
Munzner, T. (2014). Visualization analysis and design. CRC Press. https://doi.org/10.1201/b17511
Okan, Y., Garcia-Retamero, R., Cokely, E. T., & Maldonado, A. (2012). Individual differences in graph literacy: Overcoming denominator neglect in risk comprehension. Journal of Behavioral Decision Making, 25(4), 390–401. https://doi.org/10.1002/bdm.751
Peters, E., Västfjäll, D., Slovic, P., Mertz, C. K., Mazzocco, K., & Dickert, S. (2006). Numeracy and decision making. Psychological Science, 17(5), 407–413. https://doi.org/10.1111/j.1467-9280.2006.01720.x
Segel, E., & Heer, J. (2010). Narrative visualization: Telling stories with data. IEEE Transactions on Visualization and Computer Graphics, 16(6), 1139–1148. https://doi.org/10.1109/TVCG.2010.179
Shneiderman, B. (1996). The eyes have it: A task by data type taxonomy for information visualizations. In Proceedings 1996 IEEE Symposium on Visual Languages (pp. 336–343). IEEE. https://doi.org/10.1109/VL.1996.545307
Tufte, E. R. (2001). The visual display of quantitative information (2nd ed.). Graphics Press.
Ware, C. (2013). Information visualization: Perception for design (3rd ed.). Morgan Kaufmann.