
Insights · Communicating insight
Writing an Executive Summary of Research Insights
How to write an executive summary that busy decision makers will read and act on, covering structure, what to include and leave out, plain language, numbers and uncertainty, layout, common mistakes and a worked example.
For many decision makers, the executive summary is the research. They may never read the full report, look at the appendices or attend the debrief. What they understand of months of work is what they take from one or two pages. An executive summary is therefore not a formality added at the end but often the most important part of a research report to get right. This article explains what an executive summary should do, how to structure it, how to write it clearly and how to avoid the most common mistakes.
What an executive summary is for
An executive summary should allow a reader who reads nothing else to understand the main findings, what they mean and what should be done. It is not an introduction to the report, a description of the method or a list of the chapters. It is a short, self-contained version of the report's argument.
Simon (1971) observed that in an information-rich world, attention becomes the scarce resource. Senior decision makers receive far more material than they can read, and they decide quickly what deserves their time. Research on the use of evidence in policy making has found the same. Oliver et al. (2014) systematically reviewed studies of the barriers to and facilitators of the use of evidence by policy makers and found that the availability of timely, relevant and clearly presented research was among the most frequently reported factors. Lavis et al. (2005) recommended that research intended for managers and policy makers be presented in a graded format: a page of main messages, a short executive summary and a full report, so that readers can choose how deep to go. This format, often described as "1:3:25", has been widely adopted in health services research.
Lead with the point
The most important principle is to put the main conclusion first. Minto (2009) argued that business writing should begin with the answer, followed by the reasons supporting it, because readers understand and evaluate supporting points more easily when they already know what those points are meant to support.
Research on reading comprehension supports this. Bransford and Johnson (1972) gave participants a passage that was hard to understand without knowing its topic. Participants who were told the topic before reading understood and recalled the passage much better than those who were told it afterwards or not at all. Context given first organises everything that follows. An executive summary that begins with background and method forces readers to hold details in mind without knowing why they matter.
This runs against the habits of many researchers, who are trained to report work in the order it was done. Academic papers move from background to method, results and discussion. An executive summary should reverse this order.
A structure that works
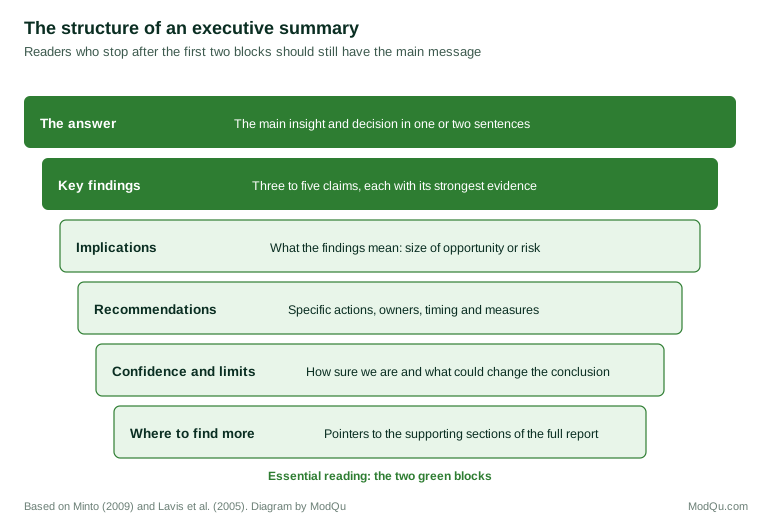
The answer. One or two sentences stating the main insight and, if the research was commissioned to inform a decision, the recommended decision. A reader who stops here should know what the research found.
Key findings. Three to five findings that support the answer, each stated as a sentence that makes a claim, with the strongest evidence for it. "Price was not the main driver of switching: only 18% of customers who left cited price, against 41% who cited service failures" is a finding. "Price" is a topic.
Implications. What the findings mean for the organisation: the size of the opportunity or risk, and which existing assumptions they confirm or challenge.
Recommendations. Specific actions, with owners and timing where possible, and how success would be measured.
Confidence and limits. How strong the evidence is, what it does not show and what would change the conclusion. This can be brief, but it should not be absent.
Where to find more. A sentence pointing to the sections of the full report that support each finding.
A short note on method can be included where it affects how much weight the findings deserve, for example "based on a survey of 2,400 customers and 30 in-depth interviews", but the full method belongs in the body of the report.
Write findings as claims
Many executive summaries list topics rather than findings: "Customer satisfaction", "Brand perceptions", "Channel usage". Each heading tells the reader what was studied but not what was learned. Hartley and Benjamin (1998) compared traditional and structured abstracts in psychology journals and found that structured abstracts, which use set headings to ensure that key information is included, were more informative and easier to search. A similar principle applies to executive summaries: a consistent structure and findings stated as claims make it harder to omit what matters. Haynes et al. (1990) reviewed the use of "more informative abstracts" in medical journals, which require authors to state specific results rather than describe what was studied, and found that they improved the information available to readers.
Write plainly
Plain language helps all readers, including expert ones. Kimble (2012) collected studies from business, government and law showing that documents rewritten in plain language were understood better, preferred by readers, including specialist readers, and saved organisations time and money. Oppenheimer (2006) found that texts using unnecessarily complex vocabulary led readers to judge the authors as less intelligent, not more. Pinker (2014) attributed much unclear writing to the "curse of knowledge": experts find it hard to imagine what it is like not to know what they know, so they leave out steps, use jargon and refer to concepts the reader has never met. Williams and Bizup (2014) recommended making the main characters of a sentence its subjects and the main actions its verbs, which produces sentences that are shorter and easier to follow.
Strunk and White (2000) put the principle briefly: omit needless words. Several practices help:
- Use short sentences and common words. Flesch (1948) developed one of the first readability formulas, based on sentence length and word length, and readability measures based on the same principles remain widely used.
- Avoid jargon and internal codes. Write "customers who have bought at least twice" rather than "repeaters (R2+)".
- Put the subject and verb early. "Delivery delays caused most complaints" is easier to read than "With regard to complaints, the majority were found to be attributable to delays in delivery".
- Put old information before new. Gopen and Swan (1990) recommended that each sentence begin with information the reader already has and end with the new information it adds, which helps readers follow the line of reasoning.
Handle numbers carefully
Numbers are the evidence in most research summaries, but too many numbers overwhelm. A useful rule is one key number per finding, chosen because it best supports the claim. Percentages should be accompanied by the base where it matters, and relative changes by absolute values. Rounded numbers are easier to read and remember than precise ones, and precision beyond what the data support suggests a false accuracy.
Uncertainty should be stated plainly. Spiegelhalter (2017) argued that communicating uncertainty honestly is part of earning trust. In an executive summary, this may be as simple as "we are confident about the direction of this effect but not its exact size" or "this finding is based on a small sample and should be confirmed".
Make it easy to scan
Busy readers scan before they read. Nielsen (2006) reported eye-tracking studies showing that people reading on screens often scan in a pattern resembling the letter F: across the top, then across a little lower, then down the left side, reading little of the rest. Lorch (1989) reviewed research on signalling devices in text, such as headings, previews and typographic emphasis, and found that they help readers identify the structure of a text and remember its main points.
For an executive summary, this means:
- Short paragraphs, each beginning with its main point.
- Findings that start with a bold sentence stating the claim.
- A small number of clear headings.
- At most one simple chart, if it makes the main finding clearer than words. Mayer (2009) found that words and pictures together support understanding better than words alone, but only when the picture is relevant; Shah and Hoeffner (2002) reviewed research on graph comprehension and found that the message readers take from a chart depends heavily on its format, so a summary chart should be designed to show one comparison clearly.
- Length of one to two pages. If the summary is longer, it is probably not a summary.
Common mistakes
Describing the research instead of its results. "This report presents the findings of a study of customer attitudes" tells the reader nothing they need.
Burying the answer. Placing the main conclusion at the end, after background and method.
Listing everything. Including every finding, so that the important ones are lost among the minor ones. Sweller (1988) showed that working memory is limited and that material imposing unnecessary load impairs understanding; a summary with fifteen findings asks readers to do the prioritising that the researcher should have done.
Hedging everything. Qualifying every statement so heavily that the reader cannot tell what the research found. State the main findings clearly and put the limitations in their own section.
Saying something different from the report. The summary must be consistent with the evidence in the body. A summary that goes further than the report is a form of spin.
Writing it first, or last, in a hurry. The summary is best drafted once the analysis is complete, revised as the report is finalised, and tested on someone who has not seen the work.
A worked example
Consider two openings for the same report on why customers leave a hypothetical broadband provider.
The first: "This report presents the results of a research programme conducted between March and June to understand customer attitudes towards our service. The research comprised a quantitative survey of 2,400 current and former customers and 30 in-depth interviews. The report is structured as follows..."
The second: "Most customers who leave us do so after a service failure, not because of price. Only 18% of former customers cited price as their main reason for leaving, while 41% cited a fault that took more than a week to fix. Customers who experienced such a fault were three times as likely to leave within six months. We recommend setting a five-day target for fixing faults, which we estimate would reduce annual losses by about 15,000 customers. These estimates are based on a survey of 2,400 current and former customers and 30 interviews; the effect on retention should be confirmed with a trial in one region."
The first opening tells the reader what the research was. The second tells them what it found, why it matters, what to do and how confident to be, in fewer words than a typical introduction.
Key takeaways
The executive summary is often the only part of a report decision makers read, so it should stand alone as a short version of the report's argument. It should lead with the answer, state three to five key findings as claims with their strongest evidence, set out implications and specific recommendations, and state the level of confidence and the main limits. It should use plain language, one key number per finding, honest statements of uncertainty and a layout that makes it easy to scan. Common mistakes include describing the research instead of its results, burying the answer, listing everything, hedging everything and going further than the evidence in the report.
References
Bransford, J. D., & Johnson, M. K. (1972). Contextual prerequisites for understanding: Some investigations of comprehension and recall. Journal of Verbal Learning and Verbal Behavior, 11(6), 717–726. https://doi.org/10.1016/S0022-5371(72)80006-9
Flesch, R. (1948). A new readability yardstick. Journal of Applied Psychology, 32(3), 221–233. https://doi.org/10.1037/h0057532
Gopen, G. D., & Swan, J. A. (1990). The science of scientific writing. American Scientist, 78(6), 550–558.
Hartley, J., & Benjamin, M. (1998). An evaluation of structured abstracts in journals published by the British Psychological Society. British Journal of Educational Psychology, 68(3), 443–456. https://doi.org/10.1111/j.2044-8279.1998.tb01303.x
Haynes, R. B., Mulrow, C. D., Huth, E. J., Altman, D. G., & Gardner, M. J. (1990). More informative abstracts revisited. Annals of Internal Medicine, 113(1), 69–76. https://doi.org/10.7326/0003-4819-113-1-69
Kimble, J. (2012). Writing for dollars, writing to please: The case for plain language in business, government, and law. Carolina Academic Press.
Lavis, J., Davies, H., Oxman, A., Denis, J.-L., Golden-Biddle, K., & Ferlie, E. (2005). Towards systematic reviews that inform health care management and policy-making. Journal of Health Services Research & Policy, 10(Suppl. 1), 35–48. https://doi.org/10.1258/1355819054308549
Lorch, R. F., Jr. (1989). Text-signaling devices and their effects on reading and memory processes. Educational Psychology Review, 1(3), 209–234. https://doi.org/10.1007/BF01320135
Mayer, R. E. (2009). Multimedia learning (2nd ed.). Cambridge University Press. https://doi.org/10.1017/CBO9780511811678
Minto, B. (2009). The pyramid principle: Logic in writing and thinking (3rd ed.). Prentice Hall.
Nielsen, J. (2006, April 16). F-shaped pattern for reading web content. Nielsen Norman Group.
Oliver, K., Innvær, S., Lorenc, T., Woodman, J., & Thomas, J. (2014). A systematic review of barriers to and facilitators of the use of evidence by policymakers. BMC Health Services Research, 14, Article 2. https://doi.org/10.1186/1472-6963-14-2
Oppenheimer, D. M. (2006). Consequences of erudite vernacular utilized irrespective of necessity: Problems with using long words needlessly. Applied Cognitive Psychology, 20(2), 139–156. https://doi.org/10.1002/acp.1178
Pinker, S. (2014). The sense of style: The thinking person's guide to writing in the 21st century. Viking.
Shah, P., & Hoeffner, J. (2002). Review of graph comprehension research: Implications for instruction. Educational Psychology Review, 14(1), 47–69. https://doi.org/10.1023/A:1013180410169
Simon, H. A. (1971). Designing organizations for an information-rich world. In M. Greenberger (Ed.), Computers, communications, and the public interest (pp. 37–72). Johns Hopkins Press.
Spiegelhalter, D. (2017). Risk and uncertainty communication. Annual Review of Statistics and Its Application, 4, 31–60. https://doi.org/10.1146/annurev-statistics-010814-020148
Strunk, W., Jr., & White, E. B. (2000). The elements of style (4th ed.). Longman.
Sweller, J. (1988). Cognitive load during problem solving: Effects on learning. Cognitive Science, 12(2), 257–285. https://doi.org/10.1207/s15516709cog1202_4
Williams, J. M., & Bizup, J. (2014). Style: Lessons in clarity and grace (11th ed.). Pearson.