
Insights · Communicating insight
Storytelling With Data: Narrative Structures for Insight
Why stories help audiences understand and remember insight, the narrative structures that work for data, how to build a data story step by step, how charts can carry a narrative, and the limits and ethical risks of storytelling.
An insight that is not understood, remembered and acted on has little value. Many analyses fail at this last step. They present findings as a sequence of charts and tables, each accurate, none connected, leaving the audience to work out what it all means. Storytelling offers a different approach. A story arranges information around a situation, a problem and a resolution, and gives the audience a reason to care about what happens next. Used well, it helps people understand and remember insight. Used carelessly, it can oversimplify or mislead. This article explains why stories work, the structures that suit data, and how to use them responsibly.
Why stories help
People understand the world largely through stories. Bruner (1986) distinguished two modes of thought: a "paradigmatic" mode concerned with logical argument and categories, and a "narrative" mode concerned with people, intentions and the sequence of events. Both are ways of making sense of experience, but narrative is how people most naturally explain why things happen.
Research on decision making supports this. Pennington and Hastie (1992) studied how jurors reach verdicts and found that they organise the evidence into a story, and that evidence presented in story order, following the sequence of events, was more persuasive than the same evidence presented in the order of witnesses or issues. The story that best explained the evidence tended to determine the verdict.
Stories also engage attention and reduce resistance. Green and Brock (2000) described "transportation", the experience of being absorbed into a narrative, and found that people who were more transported by a story were more likely to adopt beliefs consistent with it and less likely to look for flaws in it. Escalas (2004) found that consumers who processed advertising in narrative form formed stronger connections between brands and their own sense of self. Dahlstrom (2014) reviewed the use of narrative to communicate science to non-expert audiences and concluded that narratives are easier to understand and more engaging than traditional scientific communication, and that they are processed more quickly and recalled better.
Stories also help numbers make sense. Small et al. (2007) found that people gave more to help an identifiable individual than in response to statistics about many people in need, and that presenting statistics alongside the individual's story reduced giving to the individual. Concrete cases move people in a way that statistics do not, a point Heath and Heath (2007) built into their account of why some ideas stick and others do not.
Stories help some facts more than others
Stories are not always the best choice. Krause and Rucker (2020) found that wrapping facts in a narrative made weak facts more persuasive but made strong facts less persuasive. Narrative appears to reduce the audience's scrutiny of the evidence, which helps when the evidence is weak and hurts when it is strong, because strong evidence benefits from careful examination. Shaffer et al. (2018) reviewed research on narratives in health communication and concluded that their effects depend on the purpose: narratives can increase engagement and motivation, but they are less suited to conveying precise information and can lead people to give too much weight to a single case.
For insight work, the implication is that storytelling should organise and give meaning to strong evidence, not substitute for it. The aim is a story that makes the evidence easier to understand and examine, not one that persuades the audience not to examine it.
Narrative structures for data
Several structures from writing and presentation translate well to data.
Situation, complication, resolution
Minto (2009) described a structure for business writing in which the introduction sets out a situation the reader recognises, then a complication that creates a question, and then the answer, with the supporting arguments arranged beneath it in a hierarchy. This "pyramid" structure puts the main message first, which suits busy decision makers, while the situation and complication give it context and urgency.
The narrative arc
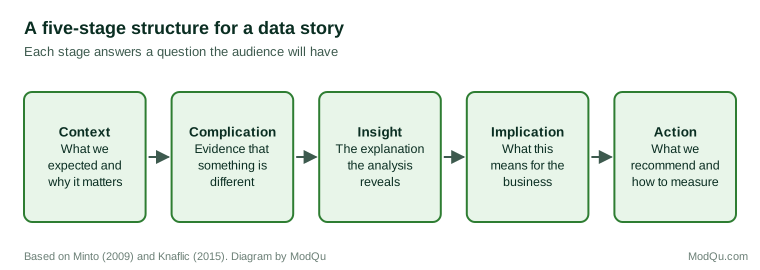
A more dramatic structure follows the arc of a classic story: a setting, rising tension as a problem develops, a turning point, and a resolution. Data stories built on this arc start with what was expected, show the evidence that something has changed or gone wrong, reveal the insight that explains it, and end with what should be done.
Contrast between what is and what could be
Duarte (2010) analysed persuasive speeches and found that many alternate between describing the world as it is and the world as it could be, building a contrast that motivates change. For insight, this structure suits recommendations: the current customer experience compared with a better one, or the current position in a market compared with an available opportunity.
Building a data story
Knaflic (2015) set out a practical process for communicating with data, which can be summarised in several steps.
Start with the audience and the decision. Identify who the story is for, what they already know, what they care about and what decision they face. A story for a finance director and one for a product team may draw on the same analysis but emphasise different points.
State the main message in one sentence. If the insight cannot be expressed in a sentence, the analysis is probably not finished. "Customers who wait more than three days for delivery are half as likely to buy again, and a third of our orders now take that long" is a story. "Here are our delivery metrics" is not.
Choose only the evidence that serves the message. Most analyses produce far more than a story can carry. Select the evidence that best supports and tests the main message, including evidence that would have contradicted it if the message were wrong. Material that does not contribute belongs in an appendix.
Arrange the evidence in a sequence. Use one of the structures above. Each step should lead naturally to the next, so that the audience arrives at the conclusion as the story reaches it.
Make each chart say one thing. A chart in a story should have a clear point, stated in its title, with the relevant part of the data highlighted.
End with action. The story should finish with what the audience should do, and how success will be measured.
Charts that carry a narrative
Visualisation researchers have studied how charts can tell stories. Segel and Heer (2010) analysed examples of narrative visualisation from journalism and other sources and described a range of designs, from "author-driven" presentations that lead the audience through a fixed sequence to "reader-driven" ones that let the audience explore. They found that many effective designs combine the two, guiding the reader through the main story before allowing exploration. Kosara and Mackinlay (2013) argued that storytelling was a natural next step for visualisation research, because presenting findings is as important as finding them. Gershon and Page (2001) made an early case that the techniques of storytelling could make information visualisations more effective.
The order in which charts are shown matters. Hullman et al. (2013) studied sequences of visualisations and found that people tended to prefer sequences in which the change from one chart to the next was small and consistent, such as keeping the same type of chart while changing one element, which made the story easier to follow.
Several design choices help a chart carry a narrative:
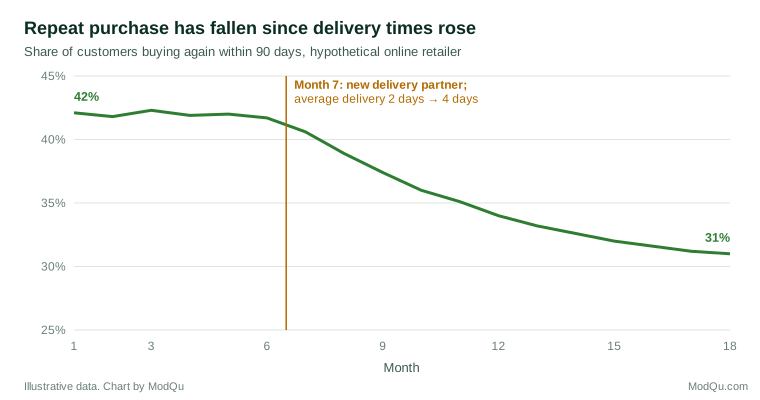
- An active title. "Repeat purchase has fallen since delivery times rose" tells the audience what to see; "Repeat purchase rate, 2023–2025" does not.
- Emphasis. Highlight the series or period that matters and show the rest in a muted colour.
- Annotation. Mark the events that explain changes in the data directly on the chart.
- Removal of clutter. Tufte (2001) argued for removing ink that does not convey data, so that the data stand out.
These choices are supported by research on learning. Mayer (2009) summarised experiments on how people learn from words and pictures and identified a "signalling" principle: people learn better when cues highlight the essential material and its organisation, and a "coherence" principle: people learn better when extraneous material is removed. Highlighting, annotation and active titles are forms of signalling; removing clutter applies the coherence principle.
Decoration is a more complicated question. Bateman et al. (2010) compared plain charts with heavily illustrated versions of the same charts and found that the illustrated versions were interpreted as accurately and were remembered better after two to three weeks. Borkin et al. (2013) studied thousands of visualisations and found that features such as colour, human-recognisable objects and unusual designs made charts more memorable. Memorability is not the same as understanding, but these studies suggest that a carefully chosen visual element can help a key chart stay in the audience's mind.
Stories in different settings
The same story needs different forms in different settings.
Live presentations. The presenter controls the sequence, so the narrative arc works well. Each slide should carry one point, with the main message stated in the title. Detail can be given verbally or held back for questions.
Written reports. Readers move at their own pace and often read only the beginning. The pyramid structure, with the answer first, suits written reports better than a dramatic build-up. An executive summary should be able to stand alone as a short version of the whole story.
Dashboards. Dashboards are mainly for monitoring, not storytelling, but they can include narrative elements: a short written summary of what has changed, annotations on key charts, and a default view that leads with the most important measure.
Workshops. In workshops, the audience may help build the story. Presenting the context and complication, then asking participants to propose explanations before revealing the insight, can increase engagement and acceptance, because people are more committed to conclusions they have helped to reach.
Testing a story before telling it
A data story should be tested in the same way as any other piece of analysis. Several questions help:
- Does every chart support the main message, and does any important evidence point the other way?
- Would the story still hold if the most striking example were removed?
- Can someone who did not do the analysis summarise the message after hearing the story once?
- Has someone sceptical of the conclusion reviewed it?
- Is the uncertainty stated, and is the recommended action proportionate to it?
Rehearsing the story with a colleague from outside the project is often the quickest way to find gaps in the logic and places where the audience will lose the thread.
The limits of storytelling
Storytelling has risks that insight teams must manage.
Oversimplification. Stories need a clear cause and a clear resolution. Real data are often messier, with several causes, uncertain effects and results that do not fit. Kahneman (2011) described how people construct coherent stories from limited evidence and then feel more confident than the evidence justifies, because coherence feels like truth. A data story that leaves out the untidy parts may be more convincing than the analysis supports.
Framing. Hullman and Diakopoulos (2011) analysed how narrative visualisations frame data through choices such as which data to include, how to annotate them and what comparisons to show, and found that these "rhetorical" choices can shape the audience's interpretation substantially. Every story frames its evidence, and the frame should be chosen to clarify, not to mislead.
The single case. Because individual stories are powerful, a vivid example can outweigh the statistics it was meant to illustrate. An example should be chosen because it is typical of the pattern, and the audience should be told how typical it is.
Uncertainty. Narrative structures rarely make room for doubt. Good data stories state how confident the analysis is and what would change the conclusion.
A worked example
Consider a hypothetical online retailer whose insight team has found that repeat purchases have fallen. A conventional presentation might show twenty charts: sales by region, by product, by channel, by customer age and by month, followed by a list of observations.
A data story would be built differently. The context: repeat customers generate 60% of revenue, and their repeat purchase rate was stable for two years. The complication: since month 7 the rate has fallen from 42% to 31%, a loss equivalent to several million in annual revenue. The insight: the fall began when the company changed delivery partner, and average delivery times rose from two days to four; customers whose orders took more than three days were half as likely to buy again, and the effect appears in every region and product group, which rules out the most obvious alternative explanations. The implication: delivery speed matters more to retention than the company had assumed, and the savings from the new partner are much smaller than the revenue lost. The action: test a faster delivery option for repeat customers in two regions for three months, and measure repeat purchase against matched regions.
The story uses perhaps four charts, each with an active title. The remaining analysis is still available in an appendix for anyone who wants to check it. The story is no less rigorous than the twenty-chart version. It is simply organised around the question the audience needs answered. It also states its limits: the analysis shows a strong association between delivery time and repeat purchase, but not yet proof that faster delivery will restore the lost purchases, which is why the recommended action is a test rather than an immediate change of supplier. That honesty makes the story more credible, not less, because the audience can see exactly what is known and what remains to be established.
Key takeaways
People understand and remember information more easily when it is organised as a story, and evidence presented in narrative order can be more persuasive. Stories reduce scrutiny, which helps weak evidence and can hurt strong evidence, so storytelling should organise strong evidence rather than replace it. Useful structures include situation, complication and resolution; the narrative arc of context, complication, insight, implication and action; and the contrast between what is and what could be. A good data story starts with the audience and the decision, states one main message, selects evidence that supports and tests it, uses charts with active titles and annotation, and ends with action. Storytelling should not oversimplify, frame data misleadingly, rely on unrepresentative cases or hide uncertainty.
References
Bateman, S., Mandryk, R. L., Gutwin, C., Genest, A., McDine, D., & Brooks, C. (2010). Useful junk? The effects of visual embellishment on comprehension and memorability of charts. In Proceedings of the SIGCHI Conference on Human Factors in Computing Systems (pp. 2573–2582). ACM. https://doi.org/10.1145/1753326.1753716
Borkin, M. A., Vo, A. A., Bylinskii, Z., Isola, P., Sunkavalli, S., Oliva, A., & Pfister, H. (2013). What makes a visualization memorable? IEEE Transactions on Visualization and Computer Graphics, 19(12), 2306–2315. https://doi.org/10.1109/TVCG.2013.234
Bruner, J. (1986). Actual minds, possible worlds. Harvard University Press.
Dahlstrom, M. F. (2014). Using narratives and storytelling to communicate science with nonexpert audiences. Proceedings of the National Academy of Sciences, 111(Suppl. 4), 13614–13620. https://doi.org/10.1073/pnas.1320645111
Duarte, N. (2010). Resonate: Present visual stories that transform audiences. Wiley.
Escalas, J. E. (2004). Narrative processing: Building consumer connections to brands. Journal of Consumer Psychology, 14(1–2), 168–180. https://doi.org/10.1207/s15327663jcp1401&2_19
Gershon, N., & Page, W. (2001). What storytelling can do for information visualization. Communications of the ACM, 44(8), 31–37. https://doi.org/10.1145/381641.381653
Green, M. C., & Brock, T. C. (2000). The role of transportation in the persuasiveness of public narratives. Journal of Personality and Social Psychology, 79(5), 701–721. https://doi.org/10.1037/0022-3514.79.5.701
Heath, C., & Heath, D. (2007). Made to stick: Why some ideas survive and others die. Random House.
Hullman, J., & Diakopoulos, N. (2011). Visualization rhetoric: Framing effects in narrative visualization. IEEE Transactions on Visualization and Computer Graphics, 17(12), 2231–2240. https://doi.org/10.1109/TVCG.2011.255
Hullman, J., Drucker, S., Henry Riche, N., Lee, B., Fisher, D., & Adar, E. (2013). A deeper understanding of sequence in narrative visualization. IEEE Transactions on Visualization and Computer Graphics, 19(12), 2406–2415. https://doi.org/10.1109/TVCG.2013.119
Kahneman, D. (2011). Thinking, fast and slow. Farrar, Straus and Giroux.
Knaflic, C. N. (2015). Storytelling with data: A data visualization guide for business professionals. Wiley. https://doi.org/10.1002/9781119055259
Kosara, R., & Mackinlay, J. (2013). Storytelling: The next step for visualization. Computer, 46(5), 44–50. https://doi.org/10.1109/MC.2013.36
Krause, R. J., & Rucker, D. D. (2020). Strategic storytelling: When narratives help versus hurt the persuasive power of facts. Personality and Social Psychology Bulletin, 46(2), 216–227. https://doi.org/10.1177/0146167219853845
Mayer, R. E. (2009). Multimedia learning (2nd ed.). Cambridge University Press. https://doi.org/10.1017/CBO9780511811678
Minto, B. (2009). The pyramid principle: Logic in writing and thinking (3rd ed.). Prentice Hall.
Pennington, N., & Hastie, R. (1992). Explaining the evidence: Tests of the story model for juror decision making. Journal of Personality and Social Psychology, 62(2), 189–206. https://doi.org/10.1037/0022-3514.62.2.189
Segel, E., & Heer, J. (2010). Narrative visualization: Telling stories with data. IEEE Transactions on Visualization and Computer Graphics, 16(6), 1139–1148. https://doi.org/10.1109/TVCG.2010.179
Shaffer, V. A., Focella, E. S., Hathaway, A., Scherer, L. D., & Zikmund-Fisher, B. J. (2018). On the usefulness of narratives: An interdisciplinary review and theoretical model. Annals of Behavioral Medicine, 52(5), 429–442. https://doi.org/10.1093/abm/kax008
Small, D. A., Loewenstein, G., & Slovic, P. (2007). Sympathy and callousness: The impact of deliberative thought on donations to identifiable and statistical victims. Organizational Behavior and Human Decision Processes, 102(2), 143–153. https://doi.org/10.1016/j.obhdp.2006.01.005
Tufte, E. R. (2001). The visual display of quantitative information (2nd ed.). Graphics Press.