
The Generation of Knowledge · Knowledge economy
The Knowledge Economy: Concepts and Measurement
Where the idea of a knowledge economy came from, what economists mean by it, how its size and growth are measured through research spending, skills, patents and intangible investment, and the limits of those measures.
The phrase knowledge economy describes an economy in which the production, distribution and use of knowledge are central to growth, employment and competition. It suggests that what matters most in modern economies is not land, machinery or raw materials but ideas, skills and information. The idea has shaped government strategies, business thinking and public debate for decades. Yet it is not easy to say exactly what a knowledge economy is, or to measure how large one has become. This article traces the origins of the concept, explains how economists and statisticians have tried to measure it, and examines what the measures can and cannot tell us.
Origins of the idea
Measuring knowledge industries
The first systematic attempt to measure the knowledge economy was made by Machlup (1962). He defined knowledge production broadly, including education, research and development, communication media, information machines such as computers and office equipment, and information services such as law, finance and accounting. Adding up spending on these activities, he estimated that knowledge industries accounted for roughly 29% of gross national product in the United States in 1958, and that they were growing faster than the economy as a whole.
Porat (1977) took a different approach for the United States Department of Commerce. He divided the economy into a primary information sector, which sold information goods and services in markets, and a secondary information sector, made up of information activities carried out inside other firms and government, such as planning, record-keeping and management. By his estimates, these information activities together accounted for close to half of national income by 1967, and a similar share of employment.
Post-industrial society and knowledge workers
Social theorists reached similar conclusions by other routes. Drucker (1969) argued that knowledge had become the central capital and the crucial resource of the economy, and he popularised the term knowledge worker for people who work mainly with information and ideas rather than with their hands. Bell (1973) described the coming of a post-industrial society, in which services would replace manufacturing as the main source of employment, professional and technical occupations would grow, and theoretical knowledge would become the main source of innovation and policy.
Knowledge in economic growth
Economists, meanwhile, discovered how much of economic growth could not be explained by more labour and capital. Solow (1957) estimated that, in the United States between 1909 and 1949, only about one-eighth of the growth in output per hour of work could be attributed to more capital per worker. The remainder, about seven-eighths, he attributed to technical change in the broad sense of everything that made inputs more productive. Abramovitz (1956) reached a similar result and called the unexplained residual "some sort of measure of our ignorance" about the causes of growth.
Later theories brought knowledge into the centre of economic models. Romer (1990) argued that growth is driven by the creation of new ideas through deliberate investment in research. Ideas differ from ordinary goods because they are non-rival: one person's use of an idea does not prevent others from using it. Once created, an idea can be used again and again at little extra cost, which allows knowledge to generate increasing returns and sustained growth.
The OECD and policy
The term "knowledge-based economy" entered mainstream policy through the Organisation for Economic Co-operation and Development. OECD (1996) defined knowledge-based economies as economies directly based on the production, distribution and use of knowledge and information. It argued that investment in research, education, software and networks was becoming as important as investment in physical equipment, and it called for new indicators to measure these investments. Governments in many countries adopted knowledge-economy strategies in the years that followed.
Godin (2006) examined the history of the concept and argued that it served more as a rhetorical umbrella than a precise framework. The term brought together many existing ideas and statistics, such as R&D spending, education and information technology, under a single appealing label. This helped attract political attention, but it did not settle what exactly should be measured.
What the knowledge economy is
Powell and Snellman (2004) reviewed the research and defined the knowledge economy as production and services based on knowledge-intensive activities that contribute to an accelerated pace of technical and scientific advance and to rapid obsolescence. Its key feature, they argued, is a greater reliance on intellectual capabilities than on physical inputs or natural resources. They noted three strands of evidence: the growth of industries based on science and technology, the rising share of skilled and professional work, and changes in how work is organised to make greater use of employees' knowledge.
Several features distinguish knowledge-based activity from the production of physical goods.
Non-rivalry. As Romer (1990) argued, knowledge can be used by many people at once. This makes it valuable but also hard to sell, because others can often use it without paying.
Cumulativeness. New knowledge builds on old knowledge, so investment in knowledge can make further investment more productive.
Complementarity. Knowledge often produces value only in combination with other assets: skilled people, suitable organisation and specialised equipment.
Spillovers. Knowledge created by one firm often benefits others, through publications, the movement of staff, imitation and informal contact.
These features matter for measurement, because they mean that the value of knowledge often does not appear where it was created, and much of it is never bought or sold in a market.
How the knowledge economy is measured
Statisticians and economists measure the knowledge economy through several families of indicators. Figure 1 groups the most common.
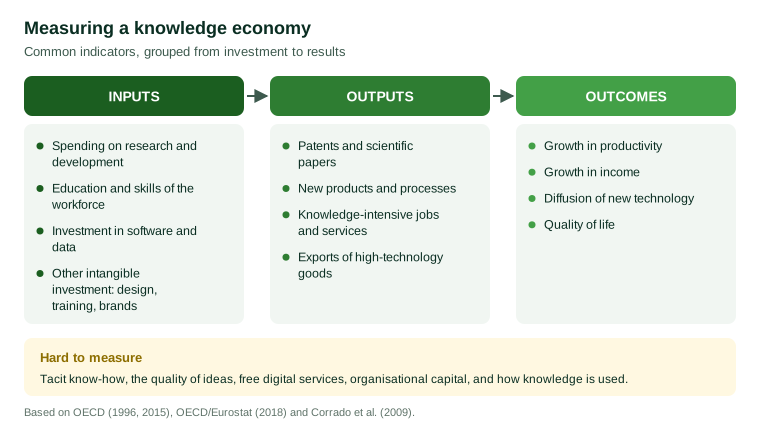
Research and development
The most established indicator is spending on research and development. The rules for collecting R&D statistics are set out in the Frascati Manual, first published by the OECD in 1963 and most recently revised in 2015. It defines R&D as creative and systematic work undertaken to increase the stock of knowledge and to devise new applications of available knowledge, and it sets criteria for distinguishing R&D from related activities (OECD, 2015). R&D spending as a share of gross domestic product, often called R&D intensity, is widely used to compare countries and track change over time.
R&D statistics have important strengths: they are collected in a consistent way across many countries and over long periods. But they cover only one form of knowledge investment. Much innovation, especially in services and small firms, takes place without formal R&D.
Innovation surveys
To capture innovation more broadly, many countries carry out innovation surveys of businesses, following the guidelines of the Oslo Manual (OECD/Eurostat, 2018). These surveys ask firms whether they have introduced new or improved products or business processes, what they spent on innovation activities and where their ideas came from. They show that innovation is far more widespread than R&D statistics suggest, but they depend on how respondents interpret questions about what counts as new.
Patents and publications
Patents provide a record of inventions with detailed information about their technology, owners and location. Griliches (1990) reviewed their use as economic indicators and concluded that patent counts are a valuable, though imperfect, measure of inventive activity. Not all inventions are patented, the tendency to patent differs greatly between industries, and the value of patents varies enormously: a small number are extremely valuable and most are worth little. Counts of scientific publications play a similar role for research, with similar limitations.
Education and skills
A knowledge economy depends on the knowledge of its workforce. Common indicators include years of schooling, the share of adults with tertiary education and the share of workers in professional, scientific and technical occupations. Hanushek and Woessmann (2008) argued that what matters most for growth is not years of schooling but what people actually learn. Using international tests of student achievement, they found that measures of cognitive skills were much more strongly related to economic growth than measures of time spent in school.
Changes in technology have also changed which skills are in demand. Autor et al. (2003) found that computers substituted for workers in routine tasks, such as calculation and record-keeping, while complementing workers in non-routine tasks requiring problem-solving and complex communication. Goldin and Katz (2008) described the history of the United States as a race between education and technology, in which wages for skilled workers rose when the supply of education failed to keep pace with the demand created by new technology.
Intangible investment
The most important development in measurement since the 1990s has been the attempt to measure intangible investment. Corrado et al. (2009) argued that business spending on software, databases, R&D, design, market research, brands, training and organisational improvement should be treated as investment, because it produces benefits over many years, just as spending on buildings and machinery does. Their estimates for the United States showed that business investment in such intangibles had grown to be as large as investment in tangible capital, and that including it changed the picture of where growth came from: capital deepening, much of it intangible, explained more of the growth in labour productivity, and the unexplained residual became smaller.
National accounts have gradually incorporated some of these items. Software, databases and R&D are now treated as investment in the international standards for national accounts, but many other intangibles, such as training, organisational capital and brands, are still not. Haskel and Westlake (2018) argued that intangible assets have distinctive economic properties: they are often costly to create but cheap to copy, their benefits spill over to others, they tend to be more valuable in combination, and they are hard to use as security for loans. These properties help explain why economies rich in intangibles may behave differently, for example in the rise of very large firms and in growing differences between leading and lagging firms.
Information technology
Investment in information and communication technology is another common indicator. Brynjolfsson and Hitt (2000) found that the benefits of investment in computers depended on complementary changes in how firms were organised, such as decentralised decision-making, new business processes and investment in skills. These complementary investments are themselves largely intangible and rarely measured.
Where knowledge activity is located
National figures hide large differences between places. Knowledge spillovers are strongest over short distances: Jaffe et al. (1993) found that patents were more likely to cite earlier patents from the same metropolitan area than would be expected by chance, suggesting that knowledge passes most easily between people who live and work near one another. Moretti (2012) showed that in the United States, innovative industries and highly educated workers had become increasingly concentrated in a small number of cities, and that each new job in such industries supported several further local jobs in services. Florida (2002) argued that cities attracting a "creative class" of professionals, scientists and artists gained an economic advantage. Regional indicators of R&D, patents, skills and knowledge-intensive employment are therefore needed alongside national ones, because a country's knowledge economy may be concentrated in a few places while others are left behind.
The limits of measurement
Each indicator captures part of the knowledge economy, but none captures the whole, and several problems run through all of them.
Much knowledge is never traded
Tacit knowledge, the skills and judgement people acquire through experience, is central to economic performance but is not bought or sold separately, and so does not appear in economic statistics. Knowledge created inside firms for their own use is recorded, if at all, only through its costs.
Free and changing products
Many knowledge goods are provided free of charge, such as search engines, online encyclopaedias and open-source software. Coyle (2014) argued that gross domestic product, designed for an economy of physical goods, struggles to capture the value of such goods and the rapid improvements in quality that characterise digital products. As a result, conventional statistics may understate the growth of the knowledge economy.
Timing
Investments in knowledge often take years to pay off. Brynjolfsson et al. (2021) argued that when firms invest heavily in intangible assets to make use of a new general-purpose technology, such as artificial intelligence, measured productivity may at first appear to fall, because the investment is not counted while the costs are. Later, when the benefits arrive, measured productivity may overstate actual progress. They called this pattern a productivity J-curve.
Composite indices
International organisations have combined indicators into composite indices that rank countries on their knowledge economy or innovation performance. Such indices are useful for summarising a complex picture, but the results depend on which indicators are included and how they are weighted. Users should look behind the overall score to the indicators themselves.
Why measurement matters
Measuring the knowledge economy is not merely an academic exercise. Governments use indicators to set targets for research spending, education and digital infrastructure, and to judge whether their policies are working. Businesses use them to decide where to locate, whom to hire and where to invest. Investors use measures of intangible assets to value firms whose worth lies mostly in their knowledge.
Poor measurement can lead to poor decisions. If only formal R&D is counted, policy may neglect the design, training and organisational investments that much innovation depends on. If only tangible assets appear in the accounts, firms rich in knowledge may be undervalued, and investment in knowledge may be discouraged.
Implications for research organisations
The knowledge economy is also the setting in which survey and research organisations work. Their products, data, analysis and reports, are themselves knowledge goods, with the properties described above. Their value depends on how they are combined with the knowledge and decisions of those who use them.
Research organisations also contribute to measurement. Innovation surveys, business surveys on intangible investment, skills surveys and studies of how firms use data all depend on well-designed questionnaires and samples. The quality of what is known about the knowledge economy depends, in part, on the quality of these surveys. Questions about intangible investment, for example, are difficult for respondents to answer because firms rarely record spending on training, design or organisational change separately, and careful questionnaire design and testing are needed to obtain reliable answers.
Conclusion
The knowledge economy is a broad concept that describes the growing importance of ideas, skills and information in economic life. It has roots in Machlup's measurement of knowledge industries, Porat's information economy, Drucker's knowledge workers and Bell's post-industrial society, and it gained theoretical support from growth economics, which showed that knowledge drives long-term growth. Measuring it requires several families of indicators, from R&D spending and innovation surveys to patents, skills and intangible investment. Each captures part of the picture, and each has limits. Much knowledge is tacit, untraded or free, and its returns may take years to appear. For those who use knowledge-economy statistics, the lesson is to understand what each indicator measures and to combine several rather than rely on any one.
References
Abramovitz, M. (1956). Resource and output trends in the United States since 1870. American Economic Review, 46(2), 5–23.
Autor, D. H., Levy, F., & Murnane, R. J. (2003). The skill content of recent technological change: An empirical exploration. Quarterly Journal of Economics, 118(4), 1279–1333. https://doi.org/10.1162/003355303322552801
Bell, D. (1973). The coming of post-industrial society: A venture in social forecasting. Basic Books.
Brynjolfsson, E., & Hitt, L. M. (2000). Beyond computation: Information technology, organizational transformation and business performance. Journal of Economic Perspectives, 14(4), 23–48. https://doi.org/10.1257/jep.14.4.23
Brynjolfsson, E., Rock, D., & Syverson, C. (2021). The productivity J-curve: How intangibles complement general purpose technologies. American Economic Journal: Macroeconomics, 13(1), 333–372. https://doi.org/10.1257/mac.20180386
Corrado, C., Hulten, C., & Sichel, D. (2009). Intangible capital and U.S. economic growth. Review of Income and Wealth, 55(3), 661–685. https://doi.org/10.1111/j.1475-4991.2009.00343.x
Coyle, D. (2014). GDP: A brief but affectionate history. Princeton University Press.
Drucker, P. F. (1969). The age of discontinuity: Guidelines to our changing society. Harper & Row.
Florida, R. (2002). The rise of the creative class: And how it's transforming work, leisure, community and everyday life. Basic Books.
Godin, B. (2006). The knowledge-based economy: Conceptual framework or buzzword? Journal of Technology Transfer, 31(1), 17–30. https://doi.org/10.1007/s10961-005-5010-x
Goldin, C., & Katz, L. F. (2008). The race between education and technology. Belknap Press of Harvard University Press.
Griliches, Z. (1990). Patent statistics as economic indicators: A survey. Journal of Economic Literature, 28(4), 1661–1707.
Hanushek, E. A., & Woessmann, L. (2008). The role of cognitive skills in economic development. Journal of Economic Literature, 46(3), 607–668. https://doi.org/10.1257/jel.46.3.607
Haskel, J., & Westlake, S. (2018). Capitalism without capital: The rise of the intangible economy. Princeton University Press.
Jaffe, A. B., Trajtenberg, M., & Henderson, R. (1993). Geographic localization of knowledge spillovers as evidenced by patent citations. Quarterly Journal of Economics, 108(3), 577–598. https://doi.org/10.2307/2118401
Machlup, F. (1962). The production and distribution of knowledge in the United States. Princeton University Press.
Moretti, E. (2012). The new geography of jobs. Houghton Mifflin Harcourt.
OECD. (1996). The knowledge-based economy (OCDE/GD(96)102). OECD.
OECD. (2015). Frascati manual 2015: Guidelines for collecting and reporting data on research and experimental development. OECD Publishing. https://doi.org/10.1787/9789264239012-en
OECD/Eurostat. (2018). Oslo manual 2018: Guidelines for collecting, reporting and using data on innovation (4th ed.). OECD Publishing. https://doi.org/10.1787/9789264304604-en
Porat, M. U. (1977). The information economy: Definition and measurement (OT Special Publication 77-12(1)). U.S. Department of Commerce, Office of Telecommunications.
Powell, W. W., & Snellman, K. (2004). The knowledge economy. Annual Review of Sociology, 30, 199–220. https://doi.org/10.1146/annurev.soc.29.010202.100037
Romer, P. M. (1990). Endogenous technological change. Journal of Political Economy, 98(5, Part 2), S71–S102. https://doi.org/10.1086/261725
Solow, R. M. (1957). Technical change and the aggregate production function. Review of Economics and Statistics, 39(3), 312–320. https://doi.org/10.2307/1926047