
The Generation of Knowledge · Knowledge economy
Data as an Asset: Valuing Information
Whether data can be treated as an asset, why its value is hard to measure, the main methods for valuing information, from cost and market approaches to the expected value of information in decisions, and what makes data more or less valuable.
Organisations often describe data as one of their most valuable assets. Yet few can say what their data are worth. Data rarely appear on balance sheets, are seldom bought and sold in open markets and produce value only when used. This article examines what it means to treat data as an asset, why valuing them is difficult and what methods exist for doing so. It gives particular attention to the oldest and most rigorous approach, which values information by how much it improves decisions, and draws out what this means for those who collect and use survey and research data.
Is data an asset?
In accounting, an asset is a resource controlled by an organisation from which future economic benefits are expected. Data appear to fit this definition: organisations control datasets, and they expect to benefit from them. But accounting standards record internally generated intangible assets only under strict conditions, and most data that organisations collect for their own use are not recognised as assets (International Accounting Standards Board, 2004). Their cost is treated as an expense, and their value is invisible in financial statements. Lev (2001) argued that this omission was one reason for the growing gap between the market value of knowledge-intensive companies and the value of their recorded assets.
Moody and Walsh (1999) set out to adapt the principles of asset valuation to information. They argued that information has distinctive properties that make it unlike other assets. It can be shared without being lost. Its value increases with use, rather than being consumed. It is perishable, losing value as it becomes out of date. Its value increases with accuracy and with combination with other information. More is not always better: beyond a point, additional information can overwhelm users. And information is not depleted by use. These properties mean that methods used to value physical assets cannot simply be applied to data.
Laney (2018) proposed the term infonomics for the practice of managing, measuring and monetising information as an asset. He argued that organisations should treat information with the same discipline they apply to financial and physical assets, including keeping inventories of data assets, assigning owners and measuring value.
Data in the wider economy
Statisticians have begun to measure data at the level of whole economies. National accounts now treat software and databases as investment, and some statistical agencies have gone further. Statistics Canada (2019) produced experimental estimates of the value of data, databases and data science in Canada. It estimated investment in these assets at tens of billions of Canadian dollars a year, valued mainly by the cost of the labour used to collect, store, organise and analyse data. These estimates are based on the cost of producing data assets, an approach that is practical but may understate their value to users.
Coyle et al. (2020) examined the value of data for public policy and argued that because data are non-rival, can be combined and often relate to people other than their holders, the value of data to society can differ greatly from their value to the organisations that hold them. They concluded that much of the value of data lies in linking and sharing them, which markets alone may not achieve. OECD (2015) reached a similar conclusion, arguing that data-driven innovation was becoming a major source of growth, and OECD (2019) set out the benefits and risks of improving access to data and sharing it across organisations.
Methods for valuing data
There are three broad approaches to valuing any asset: by its cost, by the price it would fetch in a market and by the income it produces. Each can be applied to data, with different strengths.
Cost-based valuation
The cost approach values data by what it cost to collect and maintain, or what it would cost to replace. Moody and Walsh (1999) recommended this approach for most organisational data because cost is relatively easy to determine. Its weakness is that cost and value are not the same. A dataset that cost little to collect may be extremely valuable, while an expensive one may be of no use at all. Cost provides a floor below which a rational organisation would not expect the value to fall, at least when the data were collected for a good reason.
Market-based valuation
The market approach values data by the price that similar data fetch when bought and sold. For some kinds of data, such as consumer lists, financial market data and syndicated research reports, markets exist and prices are observable. But most data are unique, and markets for data are thin. The paradox identified by Arrow (1962) also applies: a buyer cannot fully judge the value of data without seeing them, but once seen, the data have in effect been acquired.
Income-based valuation
The income approach values data by the additional income they generate, for example through better targeting of marketing, reduced fraud, improved efficiency or new products. Short and Todd (2017) argued that companies often understate the value of their data because they consider only current uses, not the possible future uses or the value to other parties. Income-based valuation is closest to what value really means, but it requires estimating how much of an outcome can be attributed to data rather than to the people, systems and decisions that used them.
Glazer (1993) argued that in information-intensive organisations, the value of information should be measured by its contribution to the organisation's performance, and proposed ways of tracking information as it moves through the organisation and is used in decisions.
The value of information in decisions
The most rigorous approach to valuing information comes from decision analysis. It starts from a simple idea: information has value only if it can change a decision, and its value is the expected improvement in the outcome of that decision.
Raiffa and Schlaifer (1961) developed the statistical framework for this idea, and Howard (1966) set out what he called information value theory. Before collecting information, a decision-maker faces uncertainty about some quantity, such as the size of a market, and must choose an action, such as whether to launch a product. The decision-maker can estimate the expected outcome of acting now, with current knowledge. They can also estimate the expected outcome if they first gathered information that would reduce the uncertainty. The difference between the two is the expected value of information.
Two measures are especially useful. The expected value of perfect information is the improvement that would come from knowing the uncertain quantity exactly. Because no real research gives perfect information, it sets an upper limit on what any research could be worth. The expected value of sample information is the improvement from a particular, imperfect study, such as a survey of a given size and accuracy. Figure 1 gives a simple example.
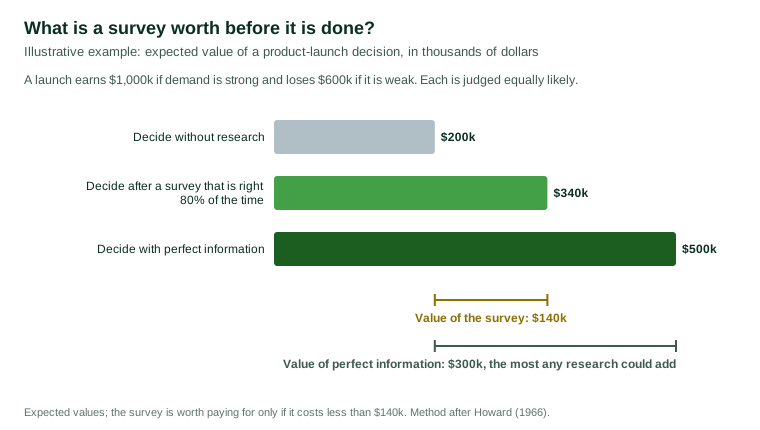
In the example, a company must decide whether to launch a product that will earn 1 million dollars if demand is strong and lose 600,000 dollars if it is weak, and judges the two outcomes equally likely. Launching without further information has an expected value of 200,000 dollars. With perfect knowledge of demand, the company would launch only when demand was strong, raising the expected value to 500,000 dollars, so perfect information is worth 300,000 dollars. A survey that correctly indicates the level of demand 80% of the time raises the expected value to 340,000 dollars, so it is worth 140,000 dollars. If it costs less than that, it is worth doing; if it costs more, the company would do better to decide without it.
This approach yields several important insights.
Information is valuable only when a decision depends on it. If the company would launch whatever the survey showed, the survey would have no decision value, however interesting its findings.
Value depends on uncertainty. Information is most valuable when the decision-maker is genuinely uncertain and when the consequences of a wrong choice are large.
Value depends on accuracy. A less accurate study is worth less. This links the value of research directly to its quality: sampling error, bias and poor measurement reduce the value of information.
There are limits. The value of perfect information is a ceiling. No study, however large, can be worth more.
Ahituv (1980) applied similar reasoning to information systems, arguing that their value should be judged by the improvement they bring to decisions, taking account of timeliness, accuracy and the form in which information is presented.
Hubbard (2014) argued that organisations frequently measure the wrong things. Applying value-of-information calculations to business decisions, he found that the variables organisations spent most effort measuring were often those with the least information value, while the most uncertain and consequential variables were often left unmeasured. He called this pattern a measurement inversion.
What makes data valuable
Beyond the logic of decisions, research has identified several properties that make data more or less valuable.
Quality
Wang and Strong (1996) surveyed data users to find out what data quality meant to them. They found that users cared about much more than accuracy. Their framework identified four broad categories: intrinsic quality, including accuracy and believability; contextual quality, including relevance, timeliness and completeness for the task; representational quality, including how easy the data are to interpret and understand; and accessibility. Data that are accurate but irrelevant, late or impossible to interpret have little value.
Redman (1998) argued that poor data quality imposes large costs on organisations, through errors in operations, poor decisions and lost trust, and that these costs are often hidden because they are spread across many activities.
Use and decision-making
Data create value only when used. Brynjolfsson et al. (2011) studied large firms in the United States and found that those that made greater use of data and analysis in decision-making had higher productivity than otherwise similar firms. Brynjolfsson and McElheran (2016), using a large survey of manufacturing plants conducted by the United States Census Bureau, found that data-driven decision-making spread rapidly in the years after 2005 and was associated with better performance.
Scale and diminishing returns
More data are not always proportionally more valuable. Bajari et al. (2019) studied the demand forecasts of a large online retailer and found that forecasts improved as data on more products became available, but that additional historical data for the same product brought diminishing improvements. Varian (2014) noted that large datasets require new analytical methods and that many of the benefits of big data come from the ability to run experiments and detect patterns rather than from sheer size.
Combination and reuse
Because data are non-rival, their value can increase when they are used for more purposes or combined with other data (Jones & Tonetti, 2020). The FAIR principles, which state that research data should be findable, accessible, interoperable and reusable, aim to increase the value of data by making reuse easier (Wilkinson et al., 2016).
Time
Data lose value over time. Information about customer preferences, market conditions or public opinion becomes outdated, sometimes quickly. Moody and Walsh (1999) emphasised that information is perishable, so its value must be reassessed as it ages. Some data, however, gain value with time: long-running series allow trends to be measured and are impossible to reconstruct once the moment of collection has passed.
Valuing survey and research data
The value-of-information approach is especially relevant to survey and research data, because such data are usually collected to inform particular decisions.
Before commissioning research, an organisation can ask: what decision will this inform, how uncertain are we and how costly would a wrong decision be? If the decision is minor, the uncertainty small or the outcome unlikely to change, extensive research is hard to justify. If the stakes are high and the uncertainty great, even costly research may be worthwhile.
The approach also guides research design. Increasing sample size reduces sampling error, but with diminishing returns: the value of information rises less and less as samples grow, while costs keep increasing. At some point, a larger sample is not worth the extra cost. Similarly, effort spent on reducing bias, through better sampling frames, higher response rates and well-tested questions, may add more value than effort spent on sample size, because bias is not reduced by collecting more data.
Survey data also have value beyond their first use. Archived and well-documented data can be reanalysed, compared with later studies and combined with other sources. A long-running tracker survey becomes more valuable each year, because each wave adds to a series that allows change to be measured. Recognising this value encourages investment in documentation, consistent methods and secure storage.
Managing data as an asset
Treating data as an asset has practical implications for organisations.
Keep an inventory. Organisations should know what data they hold, where they are, who is responsible for them and how they are used.
Assign ownership. Each important dataset should have an owner responsible for its quality, security and appropriate use.
Invest in quality. Because quality determines value, data quality should be measured and improved systematically.
Document thoroughly. Data whose origins and meaning are unclear lose value quickly. Documentation of methods, definitions and changes allows data to be reused.
Consider the decision value. When deciding what data to collect or keep, consider which decisions they inform and how much difference they make.
Manage risk. Data about people carry privacy and security obligations. A data breach or misuse can turn an asset into a liability.
Conclusion
Data are increasingly recognised as assets, but valuing them remains difficult. Accounting standards rarely record them, markets for them are thin and their value depends on how they are used. Cost, market and income approaches each capture part of their value. The decision-analytic approach, which values information by the expected improvement it brings to decisions, offers the clearest logic: information is valuable when decisions depend on it, when uncertainty is high, when the stakes are large and when the information is accurate. Quality, timeliness, relevance and the capacity to combine and reuse data all add to value. For organisations that collect and use survey and research data, these principles provide a practical guide to what to collect, how much to invest in quality and how to manage data so that their value lasts.
References
Ahituv, N. (1980). A systematic approach toward assessing the value of an information system. MIS Quarterly, 4(4), 61–75. https://doi.org/10.2307/248961
Arrow, K. J. (1962). Economic welfare and the allocation of resources for invention. In National Bureau of Economic Research (Ed.), The rate and direction of inventive activity: Economic and social factors (pp. 609–626). Princeton University Press.
Bajari, P., Chernozhukov, V., Hortaçsu, A., & Suzuki, J. (2019). The impact of big data on firm performance: An empirical investigation. AEA Papers and Proceedings, 109, 33–37. https://doi.org/10.1257/pandp.20191000
Brynjolfsson, E., Hitt, L. M., & Kim, H. H. (2011). Strength in numbers: How does data-driven decisionmaking affect firm performance? (Working paper). https://doi.org/10.2139/ssrn.1819486
Brynjolfsson, E., & McElheran, K. (2016). The rapid adoption of data-driven decision-making. American Economic Review, 106(5), 133–139. https://doi.org/10.1257/aer.p20161016
Coyle, D., Diepeveen, S., Wdowin, J., Kay, L., & Tennison, J. (2020). The value of data: Policy implications. Bennett Institute for Public Policy, University of Cambridge, and Open Data Institute.
Glazer, R. (1993). Measuring the value of information: The information-intensive organization. IBM Systems Journal, 32(1), 99–110. https://doi.org/10.1147/sj.321.0099
Howard, R. A. (1966). Information value theory. IEEE Transactions on Systems Science and Cybernetics, 2(1), 22–26. https://doi.org/10.1109/TSSC.1966.300074
Hubbard, D. W. (2014). How to measure anything: Finding the value of "intangibles" in business (3rd ed.). Wiley.
International Accounting Standards Board. (2004). IAS 38 Intangible assets. IFRS Foundation.
Jones, C. I., & Tonetti, C. (2020). Nonrivalry and the economics of data. American Economic Review, 110(9), 2819–2858. https://doi.org/10.1257/aer.20191330
Laney, D. B. (2018). Infonomics: How to monetize, manage, and measure information as an asset for competitive advantage. Routledge.
Lev, B. (2001). Intangibles: Management, measurement, and reporting. Brookings Institution Press.
Moody, D., & Walsh, P. (1999). Measuring the value of information: An asset valuation approach. In Proceedings of the Seventh European Conference on Information Systems (ECIS '99). Copenhagen Business School.
OECD. (2015). Data-driven innovation: Big data for growth and well-being. OECD Publishing. https://doi.org/10.1787/9789264229358-en
OECD. (2019). Enhancing access to and sharing of data: Reconciling risks and benefits for data re-use across societies. OECD Publishing. https://doi.org/10.1787/276aaca8-en
Raiffa, H., & Schlaifer, R. (1961). Applied statistical decision theory. Division of Research, Graduate School of Business Administration, Harvard University.
Redman, T. C. (1998). The impact of poor data quality on the typical enterprise. Communications of the ACM, 41(2), 79–82. https://doi.org/10.1145/269012.269025
Short, J. E., & Todd, S. (2017). What's your data worth? MIT Sloan Management Review, 58(3), 17–19.
Statistics Canada. (2019). The value of data in Canada: Experimental estimates (Latest Developments in the Canadian Economic Accounts, Catalogue no. 13-605-X). Statistics Canada.
Varian, H. R. (2014). Big data: New tricks for econometrics. Journal of Economic Perspectives, 28(2), 3–28. https://doi.org/10.1257/jep.28.2.3
Wang, R. Y., & Strong, D. M. (1996). Beyond accuracy: What data quality means to data consumers. Journal of Management Information Systems, 12(4), 5–33. https://doi.org/10.1080/07421222.1996.11518099
Wilkinson, M. D., Dumontier, M., Aalbersberg, I. J., Appleton, G., Axton, M., Baak, A., Blomberg, N., Boiten, J.-W., da Silva Santos, L. B., Bourne, P. E., Bouwman, J., Brookes, A. J., Clark, T., Crosas, M., Dillo, I., Dumon, O., Edmunds, S., Evelo, C. T., Finkers, R., … Mons, B. (2016). The FAIR guiding principles for scientific data management and stewardship. Scientific Data, 3, Article 160018. https://doi.org/10.1038/sdata.2016.18