
The Generation of Knowledge · Knowledge production
Surveys as Engines of Knowledge Generation
How the sample survey became one of the most productive methods for generating knowledge about people and societies, the scientific foundations that make it work, the four kinds of knowledge it produces, the errors that threaten it, and how surveys are adapting to falling response rates and new data sources.
Much of what we know about modern societies comes from asking people questions. Unemployment rates, public opinion, health behaviour, consumer confidence, household spending, crime victimisation and the reading habits of a nation are all measured mainly through sample surveys. In the twentieth century the survey became one of the most productive methods ever devised for generating knowledge about human populations. It allows a few thousand carefully chosen people, answering carefully designed questions, to speak accurately for millions. This article explains how surveys came to occupy this position, the scientific principles on which they rest, the kinds of knowledge they produce, the errors that threaten them and how they are changing.
From social survey to sample survey
Surveys of populations are old. Governments have counted their people for taxation and military service for thousands of years. The modern social survey, however, began in the late nineteenth century, when reformers set out to measure social conditions systematically. Charles Booth's investigation of poverty in London in the 1880s and 1890s, and Seebohm Rowntree's study of poverty in York in 1899, gathered detailed information about households to show how many people lived in poverty and why. Bulmer et al. (1991) traced how these social surveys developed in Britain and the United States between 1880 and 1940, as investigators sought facts that could guide social reform.
These early surveys tried to cover everyone in an area. The decisive innovation was the sample survey: studying a part of a population in order to learn about the whole. Desrosières (1998) described the long debate among statisticians about whether a sample could be trusted to represent a population, and what kind of sample was required. Some favoured purposive selection, choosing districts or people judged to be typical. Others favoured random selection.
Neyman (1934) settled the argument for most statisticians. He showed that random sampling, especially when the population is first divided into groups, or strata, allows the accuracy of estimates to be calculated from the sample itself, whereas purposive selection provides no such guarantee. His paper laid the theoretical foundation of modern survey sampling. Kish (1965) later set out the practical methods, such as stratification, clustering and weighting, by which samples of real populations could be designed and analysed.
The practical case was made in public. In the 1936 United States presidential election, the magazine Literary Digest collected some 2.4 million mail ballots and predicted the wrong winner, while much smaller polls using more careful methods predicted the result correctly. Squire (1988) showed that the magazine's failure arose from a biased list of names and from differences between those who replied and those who did not. The episode became a lasting lesson that the way a sample is chosen matters more than its size.
Converse (1987) traced the emergence of survey research in the United States between 1890 and 1960, as market researchers, pollsters, government statisticians and academic social scientists developed the methods and organisations that made surveys routine. Igo (2007) showed how surveys and polls changed how people thought about their own societies, creating the idea of a measurable "public" with average opinions and typical behaviour.
The scientific foundations
A survey generates knowledge by combining two kinds of design: the design of the sample, which determines who answers, and the design of the questionnaire, which determines what they are asked and how. Groves et al. (2009) described the survey as a process in which each step, from defining the population to analysing the data, introduces possible errors that the design must control.
Representation
The first foundation is representation. A survey begins by defining the target population, the people about whom it seeks knowledge. It then needs a sampling frame, a list or procedure from which a sample can be drawn, and a method of selection. With probability sampling, every member of the frame has a known, non-zero chance of selection, which allows researchers to estimate population values and to calculate the margin of error due to sampling. Kish (1965) showed how the efficiency of a design could be measured and improved.
Measurement
The second foundation is measurement. The answers people give depend on how questions are asked. Tourangeau et al. (2000) described the mental steps a respondent goes through in answering a question: understanding it, retrieving relevant information from memory, forming a judgement and reporting an answer in the form the question requires. Each step can go wrong. A respondent may interpret a term differently from the researcher, fail to remember an event, estimate rather than count, or adjust an answer to appear in a more favourable light.
Experiments on question wording have shown how much these details matter. Schuman and Presser (1981) conducted a long series of experiments in which different versions of a question were randomly assigned to different respondents. They found that seemingly minor changes in wording, the order of questions or the offering of a "don't know" option could change the distribution of answers. A classic example is that people are more willing to say that a society should "not allow" something than that it should "forbid" it, although the two phrasings seem logically equivalent.
Krosnick (1991) explained some of these effects through the idea of satisficing. Answering survey questions carefully takes mental effort, and respondents who are tired, uninterested or unable may take shortcuts: choosing the first reasonable answer, agreeing with statements regardless of content or giving the same answer to every item in a list. Good questionnaire design reduces the burden on respondents and the opportunities for such shortcuts.
Testing and design
Because measurement is so sensitive to design, questions must be tested before use. Presser et al. (2004) reviewed methods for testing survey questions, including expert review, cognitive interviewing, field pretests and experiments. Willis (2005) described cognitive interviewing in detail: respondents answer draft questions while thinking aloud or responding to follow-up probes, revealing how they understand and answer them. Bradburn et al. (2004) and Dillman et al. (2014) set out principles of questionnaire design, from wording and response options to layout, mode of administration and the ways of encouraging people to take part.
Four kinds of knowledge surveys produce
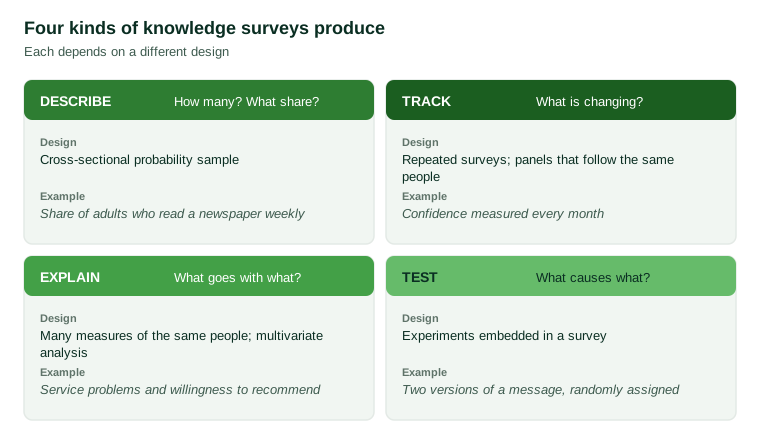
Surveys generate several different kinds of knowledge, each of which depends on a different design.
Description
The most basic kind is description: how many people in a population have a characteristic, hold an opinion or behave in a certain way. Official statistics on employment, health and income are mainly descriptive. With a probability sample, descriptive estimates come with a known margin of sampling error, which allows users to judge their precision.
Change over time
Repeating a survey with the same questions at regular intervals measures change. Repeated cross-sectional surveys, which draw a new sample each time, show how a population changes. Panel or longitudinal surveys, which follow the same people over time, show how individuals change and allow researchers to study the order in which events occur. Lazarsfeld et al. (1944) pioneered the panel method in a study of voters during the 1940 American presidential campaign, interviewing the same people several times to see how and why their intentions changed. Lynn (2009) reviewed the methods of modern longitudinal surveys, including the problems of keeping participants over many years.
Explanation
Surveys also support explanation, by measuring many characteristics of the same people and examining how they are related. A survey can show whether people with more education have different attitudes, or whether customers who experienced a service problem are less likely to recommend a company. Such associations do not prove causation, because other factors may explain them, but careful analysis that takes account of other variables can narrow the possible explanations.
Testing
Finally, surveys can test causal claims by embedding experiments. In a survey experiment, different randomly selected groups of respondents receive different versions of a question, scenario or piece of information. Because the groups are formed at random, differences in their answers can be attributed to the version they received. Mutz (2011) showed how combining experimental control with representative samples allows researchers to learn not only whether something has an effect, but whether it has that effect across a whole population.
The errors that threaten surveys
Every survey is subject to error. Biemer (2010) summarised the main sources in the total survey error framework. On the side of representation are coverage error, when the sampling frame misses part of the population; sampling error, the chance variation from studying a sample rather than everyone; and non-response error, when those who do not take part differ from those who do. On the side of measurement are errors from the questions, the respondents, the interviewers, the mode of data collection and the processing of answers. The framework encourages researchers to consider all sources together, rather than concentrating only on sampling error, which is the easiest to calculate but often not the largest.
The challenge of falling response rates
Over recent decades, the proportion of selected people who take part in surveys has fallen in many countries. Low response rates increase costs and raise the risk of non-response bias. However, a low response rate does not automatically mean a biased result. Groves and Peytcheva (2008) analysed 59 studies that had measured non-response bias directly. They found that the response rate was only a weak predictor of bias, and that bias varied more between different estimates within the same survey than between surveys with different response rates. What matters is whether the reasons people do not respond are related to the things being measured. Keeter et al. (2017) found that, after weighting, telephone surveys with low response rates still produced estimates that matched benchmark measures on many topics, although they over-represented people who were more civically engaged.
Probability and non-probability samples
The growth of the internet has made it cheap to collect survey responses from online panels of volunteers who have signed up to take part. Such samples are not selected by probability methods, so the usual theory for calculating their accuracy does not apply. A task force of the American Association for Public Opinion Research reviewed non-probability sampling and concluded that its accuracy depends on how well the methods used to select and adjust the sample account for differences between participants and the population, and that no single approach was reliable for all purposes (Baker et al., 2013). Cornesse et al. (2020) reviewed the accumulated evidence and found that probability samples were, on average, more accurate than non-probability samples, though the gap varied by topic and could sometimes be reduced through careful adjustment. For many purposes, the choice of sample depends on the precision required, the budget and the use to which the results will be put.
New modes
Surveys have also moved from face-to-face and telephone interviews to web and mobile questionnaires. Couper (2008) showed that the visual design of web surveys, such as the layout of response options and the use of images, affects answers in ways that interview surveys do not, and that design for the screen must be studied as carefully as question wording. Dillman et al. (2014) set out methods for combining modes so that each respondent can be reached in the most suitable way, while keeping measurement as consistent as possible across modes.
The survey as a social exchange
A survey depends on the willingness of strangers to give their time and share information about themselves, usually with no direct benefit. Dillman et al. (2014) argued that people decide whether to respond by weighing, often quickly, the expected rewards of taking part against its costs, and by judging whether they can trust the organisation that is asking. Rewards include a sense of being consulted, interest in the topic and the knowledge that one's answers will be useful; costs include time, effort and any feeling of intrusion or risk. Trust depends on who sponsors the survey, how clearly its purpose is explained and how confidently respondents believe their answers will be kept confidential.
This view has practical consequences. Short, well-designed questionnaires, clear explanations, respectful contact and honest promises about confidentiality and use of data all increase the willingness to respond and the quality of answers. They also maintain the general climate of public trust on which every survey organisation depends. A survey that wastes respondents' time, misuses their data or disguises a sales pitch as research damages not only its own results but the willingness of people to take part in future surveys of every kind. Treating respondents fairly is therefore both an ethical obligation and a condition of good measurement.
Surveys in a world of big data
Groves (2011) argued that surveys are entering an era in which they will increasingly be combined with other kinds of data, such as administrative records and data generated by digital activity. Such data are abundant and cheap, but they rarely measure attitudes, intentions or experiences, and they often come from unknown or unrepresentative populations. Surveys provide what found data cannot: measurement of the concepts that matter, among people who represent a known population, with documented methods. In combination, the two can be more powerful than either alone.
Why surveys remain engines of knowledge
Surveys have lasted because they combine several strengths that are hard to obtain any other way:
- Breadth. They can measure many topics among the same people, allowing relationships to be studied.
- Representation. With sound sampling, a few thousand responses can describe a population of millions with known precision.
- Direct measurement of the subjective. Only by asking can we learn what people think, feel, intend and remember.
- Comparability. Standardised questions allow comparisons between groups, places and times.
- Transparency. Methods can be documented and evaluated, and results can be checked by repeating the survey.
These strengths depend on skill. A survey with a biased sample or poorly designed questions produces confident numbers that mislead. A well-designed survey produces knowledge that can be trusted and built upon.
Practical lessons
For organisations that commission or conduct surveys, the research reviewed here suggests several lessons.
Define the population and the question first. The design of the sample and questionnaire should follow from a clear statement of who the survey is about and what decisions it should inform.
Treat the sample as evidence. Report how respondents were selected, how many took part and how the results were weighted. Users need this information to judge how far the results can be generalised.
Test every question. Cognitive interviews and pilot tests reveal misunderstandings that would otherwise go undetected.
Respect the respondent. Keep questionnaires as short and clear as possible, explain why the survey matters and protect the information people provide. Respondents who are treated well give better answers.
Consider all sources of error. The margin of sampling error is only part of the uncertainty. Coverage, non-response and measurement errors should also be considered and, where possible, measured.
Use the right design for the knowledge sought. Description, change, explanation and causal testing each require different designs. Choose deliberately.
Conclusion
The sample survey is one of the great inventions of the social sciences. Built on the theory of probability sampling and refined by decades of research on how people answer questions, it allows small samples to describe large populations, to track change, to explain relationships and to test causal claims. Its methods face real challenges, from falling response rates to competition from cheaper sources of data. Yet its central strengths, representation, direct measurement and transparency, make it as valuable as ever. In a world flooded with data of unknown origin, a well-designed survey remains one of the most reliable ways to generate knowledge about what people do, think and need.
References
Baker, R., Brick, J. M., Bates, N. A., Battaglia, M., Couper, M. P., Dever, J. A., Gile, K. J., & Tourangeau, R. (2013). Summary report of the AAPOR task force on non-probability sampling. Journal of Survey Statistics and Methodology, 1(2), 90–143. https://doi.org/10.1093/jssam/smt008
Biemer, P. P. (2010). Total survey error: Design, implementation, and evaluation. Public Opinion Quarterly, 74(5), 817–848. https://doi.org/10.1093/poq/nfq058
Bradburn, N. M., Sudman, S., & Wansink, B. (2004). Asking questions: The definitive guide to questionnaire design (Rev. ed.). Jossey-Bass.
Bulmer, M., Bales, K., & Sklar, K. K. (Eds.). (1991). The social survey in historical perspective, 1880–1940. Cambridge University Press.
Converse, J. M. (1987). Survey research in the United States: Roots and emergence, 1890–1960. University of California Press.
Cornesse, C., Blom, A. G., Dutwin, D., Krosnick, J. A., De Leeuw, E. D., Legleye, S., Pasek, J., Pennay, D., Phillips, B., Sakshaug, J. W., Struminskaya, B., & Wenz, A. (2020). A review of conceptual approaches and empirical evidence on probability and nonprobability sample survey research. Journal of Survey Statistics and Methodology, 8(1), 4–36. https://doi.org/10.1093/jssam/smz041
Couper, M. P. (2008). Designing effective web surveys. Cambridge University Press.
Desrosières, A. (1998). The politics of large numbers: A history of statistical reasoning (C. Naish, Trans.). Harvard University Press.
Dillman, D. A., Smyth, J. D., & Christian, L. M. (2014). Internet, phone, mail, and mixed-mode surveys: The tailored design method (4th ed.). Wiley.
Groves, R. M. (2011). Three eras of survey research. Public Opinion Quarterly, 75(5), 861–871. https://doi.org/10.1093/poq/nfr057
Groves, R. M., Fowler, F. J., Jr., Couper, M. P., Lepkowski, J. M., Singer, E., & Tourangeau, R. (2009). Survey methodology (2nd ed.). Wiley.
Groves, R. M., & Peytcheva, E. (2008). The impact of nonresponse rates on nonresponse bias: A meta-analysis. Public Opinion Quarterly, 72(2), 167–189. https://doi.org/10.1093/poq/nfn011
Igo, S. E. (2007). The averaged American: Surveys, citizens, and the making of a mass public. Harvard University Press.
Keeter, S., Hatley, N., Kennedy, C., & Lau, A. (2017). What low response rates mean for telephone surveys. Pew Research Center.
Kish, L. (1965). Survey sampling. Wiley.
Krosnick, J. A. (1991). Response strategies for coping with the cognitive demands of attitude measures in surveys. Applied Cognitive Psychology, 5(3), 213–236. https://doi.org/10.1002/acp.2350050305
Lazarsfeld, P. F., Berelson, B., & Gaudet, H. (1944). The people's choice: How the voter makes up his mind in a presidential campaign. Duell, Sloan and Pearce.
Lynn, P. (Ed.). (2009). Methodology of longitudinal surveys. Wiley. https://doi.org/10.1002/9780470743874
Mutz, D. C. (2011). Population-based survey experiments. Princeton University Press.
Neyman, J. (1934). On the two different aspects of the representative method: The method of stratified sampling and the method of purposive selection. Journal of the Royal Statistical Society, 97(4), 558–625. https://doi.org/10.2307/2342192
Presser, S., Couper, M. P., Lessler, J. T., Martin, E., Martin, J., Rothgeb, J. M., & Singer, E. (2004). Methods for testing and evaluating survey questions. Public Opinion Quarterly, 68(1), 109–130. https://doi.org/10.1093/poq/nfh008
Schuman, H., & Presser, S. (1981). Questions and answers in attitude surveys: Experiments on question form, wording, and context. Academic Press.
Squire, P. (1988). Why the 1936 Literary Digest poll failed. Public Opinion Quarterly, 52(1), 125–133. https://doi.org/10.1086/269085
Tourangeau, R., Rips, L. J., & Rasinski, K. (2000). The psychology of survey response. Cambridge University Press. https://doi.org/10.1017/CBO9780511819322
Willis, G. B. (2005). Cognitive interviewing: A tool for improving questionnaire design. SAGE.