
The Generation of Knowledge · Knowledge production
How Measurement Choices Shape What Can Be Known
How decisions about concepts, indicators, scales and question wording determine what research can find, the ideas of reliability and validity used to judge measures, how measures change the behaviour they measure, and how to make measurement choices deliberately and transparently.
Before anything can be counted, someone must decide what to count and how. Whether a person is "unemployed", a customer is "satisfied" or an economy is "growing" depends on definitions, indicators and procedures that someone chose. These choices are rarely visible in the final numbers, yet they shape what can be known. Different choices can produce different answers to what looks like the same question. This article examines how measurement works, how its choices influence results, how the quality of a measure is judged, and why measures sometimes change the very things they were meant to describe.
What measurement is
In the simplest sense, measurement assigns numbers or categories to things according to rules. Stevens (1946) distinguished four kinds of measurement scale. Nominal scales only name categories, such as region or brand. Ordinal scales rank, as when people rate their satisfaction from "very dissatisfied" to "very satisfied". Interval scales have equal steps but no true zero, as with temperature in degrees Celsius. Ratio scales have equal steps and a true zero, as with income or age. Stevens argued that the type of scale limits which statistical operations make sense: an average of ordinal ratings, for example, assumes that the steps between categories are equal, which may not be true.
Philosophers and statisticians have debated what measurement really is. Hand (2004) distinguished representational measurement, in which numbers represent relationships that already exist among the objects measured, such as length, from pragmatic measurement, in which the concept is partly defined by the measuring procedure itself, as with many indices of quality or well-being. Michell (1999) argued that psychology had often assumed that mental attributes, such as attitudes or abilities, could be measured on quantitative scales without testing whether they actually had a quantitative structure. These debates matter because they determine what claims a set of numbers can support.
From concept to number
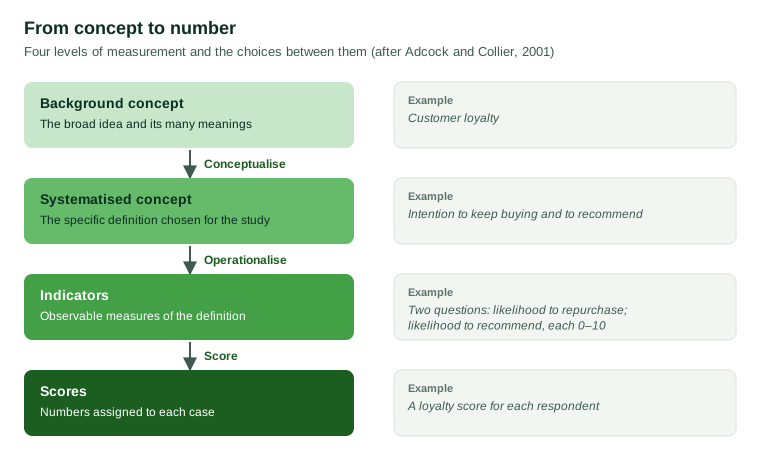
Every measurement moves from an idea to a number through a series of choices. Adcock and Collier (2001) described this movement in four levels. At the top is the background concept, the broad range of meanings associated with an idea such as "democracy", "poverty" or "customer loyalty". The researcher then forms a systematised concept, a specific definition chosen for the study. Next come indicators, the observable measures used to capture the concept, such as survey questions or recorded behaviours. Finally there are scores, the numbers assigned to each case. Each step involves choices, and each choice can be checked: does the definition capture what matters about the concept, do the indicators capture the definition, and are the scores recorded accurately?
How choices change results
Definitions
Changing the definition changes the result. Economic statistics provide clear examples. Coyle (2014) traced the history of gross domestic product and showed how choices about what to include, such as whether to count unpaid household work, how to treat financial services and how to value goods whose quality improves, affect the measured size and growth of economies. A commission led by Stiglitz, Sen and Fitoussi reviewed these choices and recommended that governments supplement output measures with measures of household income and consumption, the distribution of income, well-being and sustainability, arguing that what we measure affects what we do (Stiglitz et al., 2009).
Indicators
Different indicators of the same concept can give different pictures. Kahneman and Krueger (2006) reviewed ways of measuring subjective well-being. Asking people to evaluate their lives as a whole produces different patterns from asking how they felt during particular activities of the previous day. Income, for example, is more strongly related to overall life evaluations than to moment-to-moment feelings. Neither measure is simply right; each captures a different aspect of well-being, and the choice between them shapes the conclusions.
Questions and response scales
In surveys, small details of wording and format can change answers. Tourangeau et al. (2000) showed that respondents use every feature of a question, including its wording, its response options and the questions that came before it, to work out what is being asked. Schwarz (1999) reviewed evidence that respondents treat the response scale as information about what the researcher expects. In one study, Schwarz et al. (1985) asked people how much television they watched. When the response categories covered low amounts of viewing, fewer people reported watching more than two and a half hours a day than when the categories covered higher amounts, because respondents used the range of the scale as a guide to what was normal.
Saris and Gallhofer (2014) analysed many experiments on question design and estimated that the quality of measurement, the proportion of variation in answers that reflects the concept rather than error, differs substantially depending on choices such as the number of response categories, the labelling of scale points and the use of agree–disagree formats. Such differences can change the size of relationships found between variables.
Judging measures: reliability and validity
Researchers use two main criteria to judge measures.
Reliability is consistency. A reliable measure gives similar results when repeated under similar conditions. Classical test theory treats each observed score as the sum of a true score and random error, and reliability as the proportion of variation that reflects true differences (Lord & Novick, 1968). Nunnally and Bernstein (1994) described methods for estimating reliability, such as comparing repeated measurements or the consistency of several items intended to measure the same thing.
Validity is whether a measure captures what it is intended to capture. A measure can be reliable but not valid, as a scale that always reads two kilograms too heavy is consistent but wrong. Cronbach and Meehl (1955) introduced construct validity: when a concept cannot be observed directly, a measure is validated by showing that it relates to other measures in the ways that theory predicts. Campbell and Fiske (1959) proposed checking that a measure correlates highly with other measures of the same concept (convergent validity) and less with measures of different concepts (discriminant validity), using several methods so that agreement is not merely an artefact of a shared method.
Messick (1995) argued for a unified view of validity that also considers the consequences of using a measure. If a test or indicator leads to unfair or harmful decisions, that is a problem of validity, not only of policy.
Why measurement error matters
Measurement error does more than add noise to individual answers. It systematically changes what analysis can find. Random error in two measures weakens the correlation between them, so that a real relationship appears smaller than it is; this effect, known as attenuation, has been understood since the early twentieth century and can be corrected if the reliability of each measure is known (Nunnally & Bernstein, 1994). Unreliable measures therefore make it harder to detect real differences and relationships, and can lead researchers to conclude that something does not matter when it does. Systematic error is more dangerous still, because it does not average out. A question that leads every respondent to overstate their exercise or understate their alcohol consumption produces a biased estimate however large the sample.
Comparing across groups and over time
Measurement choices also determine whether comparisons are fair. A question may be understood differently by different groups: by younger and older respondents, by people in different regions, or by speakers of different languages when a questionnaire is translated. If so, differences in answers may reflect differences in interpretation rather than real differences in the concept being measured. Researchers use the term measurement equivalence for the requirement that a measure works in the same way across the groups being compared. It can be checked by testing translated questions carefully, by examining whether the items of a scale relate to each other in the same way in each group, and by asking respondents in cognitive interviews how they understood the questions. Comparisons over time face the same issue: if the meaning of a term changes, or if the way a question is asked changes, a trend may reflect the measure rather than the world.
When measures change what they measure
Measurement is not a neutral act of observation. Once numbers are used to judge and reward, people respond to them.
Campbell (1979) stated what is now known as Campbell's law: "The more any quantitative social indicator is used for social decision-making, the more subject it will be to corruption pressures and the more apt it will be to distort and corrupt the social processes it is intended to monitor." When schools are judged by test scores, teaching may narrow to the test; when hospitals are judged by waiting times, they may find ways to reclassify patients.
Espeland and Sauder (2007) studied how rankings of American law schools changed the schools themselves. Schools reorganised admissions, spending and reporting to improve their positions, so that the rankings, which were meant to describe quality, came to shape what quality meant. They called this reactivity. Espeland and Stevens (1998) described the broader process of commensuration, turning different qualities into a common metric, which makes comparison possible but can also strip away information that does not fit the metric.
Historians have shown that the spread of numbers has long shaped social life. Hacking (1990) described an "avalanche of printed numbers" in the early nineteenth century, as governments began counting crime, disease, suicide and other aspects of life, and argued that the categories used for counting helped create new ways of understanding people. Porter (1995) argued that quantification appeals to organisations and governments because numbers seem impersonal and objective, allowing decisions to be justified to outsiders, even when the numbers depend on contestable choices. Desrosières (1998) showed how statistical categories are constructed through negotiation among statisticians, administrators and those being counted.
Making measurement choices well
These findings do not mean that measurement is arbitrary or that numbers cannot be trusted. They mean that measurement choices should be made deliberately, tested and reported. Several principles follow.
Start with the concept. Define clearly what is to be measured and why. A vague concept produces a vague measure.
Choose indicators that fit. Use several indicators when a concept has several aspects, and check that each captures what it is meant to.
Use established measures where possible. Measures that have been tested and used widely allow comparison with other studies and come with evidence of reliability and validity.
Test new measures. Pretest questions, check reliability and look for evidence of validity before relying on new measures.
Watch the format. Response scales, labels and question order influence answers. Keep them consistent when comparing over time or between groups.
Respect the scale type. Use statistics appropriate to the kind of scale, and be cautious when treating ordinal ratings as if they were precise quantities.
Report choices openly. Explain how concepts were defined and measured so that users can understand what the numbers do and do not mean.
Anticipate reactions. When measures will be used to judge or reward, consider how people may change their behaviour in response, and monitor for distortion.
Implications for applied research
For organisations that measure opinions, behaviour and experiences for clients, measurement choices are among the most consequential decisions in any project. A satisfaction score depends on the wording of the question and the scale used; a market size depends on the definition of the market; a brand's standing depends on the attributes chosen for comparison. Clients often see only the final number. Explaining the choices behind it, and the effect that different choices might have, helps them use the number wisely.
Measurement choices also determine what can be compared. A change in question wording between two waves of a tracking study can create an apparent change in results that reflects nothing in the world. Keeping measures stable, or running old and new versions side by side when a change is necessary, protects the value of long-running data.
Conclusion
What can be known depends on how it is measured. Definitions, indicators, questions and scales are choices that shape results, and measures can change the behaviour they describe. Reliability and validity provide standards for judging measures, and transparency about measurement choices allows users to interpret results correctly. Good measurement is not about finding the one true number. It is about making clear, tested and openly reported choices, so that the numbers mean what their users think they mean.
References
Adcock, R., & Collier, D. (2001). Measurement validity: A shared standard for qualitative and quantitative research. American Political Science Review, 95(3), 529–546. https://doi.org/10.1017/S0003055401003100
Campbell, D. T. (1979). Assessing the impact of planned social change. Evaluation and Program Planning, 2(1), 67–90. https://doi.org/10.1016/0149-7189(79)90048-X
Campbell, D. T., & Fiske, D. W. (1959). Convergent and discriminant validation by the multitrait-multimethod matrix. Psychological Bulletin, 56(2), 81–105. https://doi.org/10.1037/h0046016
Coyle, D. (2014). GDP: A brief but affectionate history. Princeton University Press.
Cronbach, L. J., & Meehl, P. E. (1955). Construct validity in psychological tests. Psychological Bulletin, 52(4), 281–302. https://doi.org/10.1037/h0040957
Desrosières, A. (1998). The politics of large numbers: A history of statistical reasoning (C. Naish, Trans.). Harvard University Press.
Espeland, W. N., & Sauder, M. (2007). Rankings and reactivity: How public measures recreate social worlds. American Journal of Sociology, 113(1), 1–40. https://doi.org/10.1086/517897
Espeland, W. N., & Stevens, M. L. (1998). Commensuration as a social process. Annual Review of Sociology, 24, 313–343. https://doi.org/10.1146/annurev.soc.24.1.313
Hacking, I. (1990). The taming of chance. Cambridge University Press. https://doi.org/10.1017/CBO9780511819766
Hand, D. J. (2004). Measurement theory and practice: The world through quantification. Arnold.
Kahneman, D., & Krueger, A. B. (2006). Developments in the measurement of subjective well-being. Journal of Economic Perspectives, 20(1), 3–24. https://doi.org/10.1257/089533006776526030
Lord, F. M., & Novick, M. R. (1968). Statistical theories of mental test scores. Addison-Wesley.
Messick, S. (1995). Validity of psychological assessment: Validation of inferences from persons' responses and performances as scientific inquiry into score meaning. American Psychologist, 50(9), 741–749. https://doi.org/10.1037/0003-066X.50.9.741
Michell, J. (1999). Measurement in psychology: A critical history of a methodological concept. Cambridge University Press.
Nunnally, J. C., & Bernstein, I. H. (1994). Psychometric theory (3rd ed.). McGraw-Hill.
Porter, T. M. (1995). Trust in numbers: The pursuit of objectivity in science and public life. Princeton University Press.
Saris, W. E., & Gallhofer, I. N. (2014). Design, evaluation, and analysis of questionnaires for survey research (2nd ed.). Wiley.
Schwarz, N. (1999). Self-reports: How the questions shape the answers. American Psychologist, 54(2), 93–105. https://doi.org/10.1037/0003-066X.54.2.93
Schwarz, N., Hippler, H.-J., Deutsch, B., & Strack, F. (1985). Response scales: Effects of category range on reported behavior and comparative judgments. Public Opinion Quarterly, 49(3), 388–395. https://doi.org/10.1086/268936
Stevens, S. S. (1946). On the theory of scales of measurement. Science, 103(2684), 677–680. https://doi.org/10.1126/science.103.2684.677
Stiglitz, J. E., Sen, A., & Fitoussi, J.-P. (2009). Report by the Commission on the Measurement of Economic Performance and Social Progress. Commission on the Measurement of Economic Performance and Social Progress.
Tourangeau, R., Rips, L. J., & Rasinski, K. (2000). The psychology of survey response. Cambridge University Press. https://doi.org/10.1017/CBO9780511819322