
The Generation of Knowledge · Knowledge production
Primary Data as the Raw Material of Knowledge
What primary data are, how they differ from secondary, administrative and "found" data, why data are never simply raw, what designed data offer that big data cannot, and how to collect primary data that can bear the weight of the knowledge built on them.
Every claim to empirical knowledge rests, in the end, on data: observations recorded in some fixed form. Much of the data used today is collected for one purpose and reused for another. Sales records, website logs, social media posts and government registers are all used to answer questions their creators never considered. But a large share of what we know about people, markets and societies still comes from primary data: data collected by researchers specifically to answer their own questions, through surveys, experiments, interviews and observation. This article examines what primary data are, how they relate to other kinds of data, why the idea of "raw" data is misleading, and what makes primary data a uniquely valuable raw material for knowledge in an age of data abundance.
Primary and secondary data
The distinction between primary and secondary data concerns the relationship between the data and the question. Primary data are collected by the researcher, or on the researcher's behalf, for the purpose of the study at hand. Secondary data were collected by someone else, usually for a different purpose, and are reused (Hox & Boeije, 2005). The same data set can be primary for one study and secondary for another: a national survey is primary data for the agency that designed it and secondary data for the thousands of researchers who later analyse it.
Both have their place. Hakim (1982) described the value of secondary analysis: existing data sets are often larger, of higher quality and cheaper to use than anything a single researcher could collect, and they allow comparisons over time and between places. Heaton (2004) showed that qualitative data, such as interview transcripts, can also be reused to answer new questions. The disadvantage of secondary data is that they were designed for someone else's question. The concepts measured, the population covered, the timing and the level of detail may not match what the new study needs.
Primary data reverse these strengths and weaknesses. They are usually more expensive and slower to collect, and they may cover fewer cases. But they can be designed to measure exactly the concepts that matter, in exactly the population of interest, at the time the answer is needed.
Designed data and found data
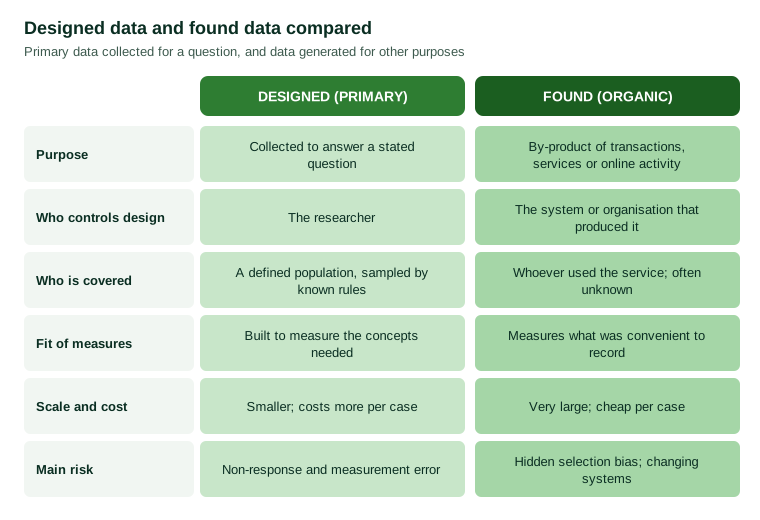
The rise of digital technology has added a third category. Groves (2011) described three eras of survey research. In the first, from about 1930 to 1960, the basic methods of sampling and questionnaire design were invented. In the second, from about 1960 to 1990, surveys expanded greatly, supported by the telephone and computers. In the third, which began around 1990, surveys face falling response rates and rising costs, but also a vast new supply of what Groves called organic data: data generated as a by-product of digital activity, such as transactions, searches, sensor readings and social media posts.
Salganik (2018) described the same contrast with an analogy from art. Organic data are like the "readymades" of the artist Marcel Duchamp, ordinary objects repurposed as art: they exist already, and the researcher's skill lies in finding a creative use for them. Designed data are "custommades", like a sculpture made for a particular purpose: they are built to answer a specific question. Salganik argued that the most powerful research often combines the two, using the scale of readymades and the precision of custommades.
Other writers distinguish administrative data, records kept by governments and organisations to run their operations, such as tax, health and education records. Connelly et al. (2016) argued that administrative data are especially valuable for social research because they often cover whole populations over long periods, but that they are shaped by the administrative processes that create them. Hand (2018) reviewed the statistical challenges of administrative and transaction data, including definitions that change over time, missing groups and errors introduced by the systems that record them.
There is no such thing as raw data
Data are often described as "raw", as though they were natural facts waiting to be processed into knowledge. Scholars who study data argue that this description is misleading. The collection of essays edited by Gitelman (2013) took its title from the observation that "raw data" is an oxymoron: data are always shaped by the decisions of those who collect them, about what to record, how to categorise it and what to leave out. Kitchin (2014) pointed out that data are not simply given; they are selected and taken from a much larger range of possible observations. What is recorded is a small and deliberate part of what could have been recorded.
Borgman (2015) emphasised that data are representations of observations, objects or other entities, used as evidence of phenomena for research. Whether something counts as data depends on how it is used, and the same records can serve as data for one purpose and be irrelevant to another. Leonelli (2016) studied how biological data travel between laboratories and databases, and showed that their value as evidence depends on the information that travels with them, such as descriptions of how, where and why they were collected.
For primary data, this has a direct consequence. Because the researcher designs the data, the researcher is responsible for the choices that shape them. Those choices should be made deliberately and documented carefully, so that later users can understand what the data can and cannot show.
What designed data offer
If organic data are abundant and cheap, why go to the expense of collecting primary data? The answer lies in several properties that only designed data reliably provide.
Measures that fit the question
Primary data can measure the concepts that matter. Organic data capture behaviour, such as purchases or clicks, but often say little about attitudes, intentions, reasons or experiences. A transaction log shows that a customer stopped buying a product; a survey can ask why. Designed data allow researchers to define concepts precisely, choose or develop valid measures and test them before use.
Known coverage and representation
The most important property of well-designed primary data is often that the researcher knows who is represented. Neyman (1934) established the theory of probability sampling, showing that when cases are selected at random from a defined population, the accuracy of estimates can be calculated. Modern survey methodology builds on this foundation (Groves et al., 2009).
Organic data rarely have this property. They cover whoever happened to use a service, post on a platform or appear in a register, and those people may differ systematically from the population of interest. boyd and Crawford (2012) warned that bigger data are not necessarily better data: a very large data set from an unrepresentative source can be less informative than a small, well-designed sample.
Meng (2018) gave this warning a precise statistical form. He showed that the error in an estimate from a non-random data set depends on the correlation between whether a person is included and the value being measured, and that even a tiny correlation can overwhelm the benefits of size. Analysing self-reported voting data in the 2016 American presidential election, he showed that a very large non-random sample could carry no more information than a properly random sample of a few hundred people. He called this the big data paradox: the larger the data set, the more confidently we may be misled if we ignore how it was produced.
The classic demonstration came long before the digital age. In 1936 the American magazine Literary Digest mailed questionnaires to millions of people, drawn largely from telephone directories and lists of car owners and magazine subscribers, and received about 2.4 million replies. It predicted a clear victory for the Republican candidate, Alf Landon. Franklin Roosevelt won in a landslide. Much smaller polls using more careful selection methods, including George Gallup's, correctly predicted Roosevelt's win. Squire (1988), analysing a survey from the time, concluded that the magazine's failure resulted from both its biased list of names and differences between those who chose to reply and those who did not: Landon's supporters were more likely to return their ballots. The lesson, that the way data are produced matters more than their quantity, applies with even greater force to the very large found data sets of today.
Control over causes
Primary data can be collected through experiments, in which the researcher controls who receives which treatment. Fisher (1935) showed that random assignment of treatments makes it possible to estimate causal effects without bias from unmeasured differences between groups. Shadish et al. (2002) described the range of experimental and quasi-experimental designs and the kinds of validity each can provide. Organic data, which record what people chose to do, rarely allow such clean causal conclusions.
Depth and meaning
Not all primary data are numerical. Interviews, focus groups, diaries and direct observation produce qualitative primary data that capture how people describe their experiences in their own words, the reasons they give for their choices and the contexts in which they act. Such data are especially valuable early in an inquiry, when researchers do not yet know which questions to ask, and later, when they need to understand why a pattern found in numerical data occurs. Found data seldom offer this depth, because the people who generated them were not asked to explain themselves. Designed qualitative and quantitative data often work best together: open conversations suggest what to measure, and structured measurement shows how widely the patterns hold.
Documentation and transparency
Because the researcher designs the data, the researcher can document every step: the population, the sample, the questions, the procedures and the processing. This documentation allows others to evaluate the data and, if necessary, to repeat the study.
Lessons from the limits of found data
The case of Google Flu Trends illustrates both the promise and the risks of found data. Ginsberg et al. (2009) showed that the volume of internet searches for flu-related terms could be used to estimate levels of influenza-like illness in the United States much faster than official surveillance reports. The method attracted wide attention as a demonstration of what big data could do. A few years later, however, Lazer et al. (2014) showed that Google Flu Trends had substantially overestimated flu levels in several seasons, at one point predicting more than double the proportion of doctor visits for influenza-like illness reported by the Centers for Disease Control and Prevention. They attributed the failure partly to "big data hubris", the assumption that large found data sets can replace traditional data collection rather than supplement it, and partly to changes in the search engine itself, which altered the data in ways the model did not anticipate.
Anderson (2008) had predicted that the flood of data would make theory and scientific method obsolete, since correlations in enough data would be sufficient. The Google Flu Trends case suggests the opposite: without understanding how data are generated, and without independent designed measures against which to check them, correlations in found data can be fragile and misleading.
A task force of the American Association for Public Opinion Research reviewed the place of big data in survey research. Japec et al. (2015) concluded that big data could complement surveys, for example by providing timely indicators or auxiliary information for sampling and weighting, but could not replace them where representative measurement of attitudes, behaviours and characteristics was needed. They called for the same attention to error that survey researchers apply to their own data.
Errors in primary data
Primary data are not automatically good data. They are subject to their own errors, which survey methodologists have analysed in detail. Biemer (2010) described the total survey error framework, which identifies errors that arise at each stage of a survey: errors of representation, such as coverage errors (some people cannot be selected), sampling errors (chance variation in who is selected) and non-response errors (selected people do not take part); and errors of measurement, such as questions that are misunderstood, answers that are inaccurate and mistakes made in processing the data. The framework treats data quality as the result of many design decisions, each of which can be improved but must also be balanced against cost.
Modern data collection also generates information about the collection process itself. Kreuter (2013) described the uses of paradata, such as the number of contact attempts, the time taken to answer each question and the device used, to monitor and improve data quality while a survey is in progress.
Finally, primary data should be explored before they are used. Tukey (1977) argued that careful exploration of data, through plots and summaries, reveals errors, outliers and patterns that formal analysis may miss. Checking data thoroughly before analysis is a basic step in turning raw material into knowledge.
Combining primary and other data
The most powerful designs often combine primary data with other sources. A survey can be linked, with consent, to administrative records, providing richer information than either source alone. Organic data can identify trends quickly, while a survey measures their causes and checks their accuracy. Administrative data can supply information for weighting survey results to match the population. Salganik (2018) described such combinations as one of the most promising directions for social research.
Combining sources requires care. Different sources define concepts differently, cover different populations and contain different errors. The documentation of each source, and an understanding of how it was produced, are essential to combining them correctly.
Primary data in practice
For organisations that generate knowledge, primary data remain the most dependable foundation for many questions. Several practical principles follow from the discussion above.
Start from the question. Define the decision or problem the data must inform, and design the data to inform it. Data collected without a clear question tend to answer none well.
Know who is represented. Define the population, choose a sampling method whose properties are known, and measure and adjust for non-response. Report who was and was not covered.
Design and test the measures. Use established measures where they exist; develop and pretest new ones where they do not. A question that respondents misunderstand produces confident but meaningless numbers.
Document everything. Record the design, procedures, questionnaire, coding and processing so that others can evaluate and reuse the data.
Check before analysing. Explore the data for errors, inconsistencies and unexpected patterns before drawing conclusions.
Use other data wisely. Combine primary data with administrative or organic data where this adds value, but understand the limits of each source.
Protect the people behind the data. Primary data about people come from people who have chosen to share information. Obtaining informed consent, protecting privacy and using data only for the purposes agreed are both ethical obligations and the conditions for continued public willingness to take part in research.
Conclusion
Primary data are not raw material in the sense of something found in nature. They are made, through choices about what to measure, whom to ask and how to record the answers. That is their strength. Because they are designed, primary data can measure the concepts that matter, represent known populations, support causal conclusions and be fully documented. Found and administrative data add scale and speed, but without designed data to define, test and calibrate them, they can mislead. As the supply of data grows, the ability to design and collect good primary data becomes more valuable, not less, because it provides the solid ground on which other kinds of data can be interpreted.
References
Anderson, C. (2008). The end of theory: The data deluge makes the scientific method obsolete. Wired, 16(7).
Biemer, P. P. (2010). Total survey error: Design, implementation, and evaluation. Public Opinion Quarterly, 74(5), 817–848. https://doi.org/10.1093/poq/nfq058
Borgman, C. L. (2015). Big data, little data, no data: Scholarship in the networked world. MIT Press.
boyd, d., & Crawford, K. (2012). Critical questions for big data: Provocations for a cultural, technological, and scholarly phenomenon. Information, Communication & Society, 15(5), 662–679. https://doi.org/10.1080/1369118X.2012.678878
Connelly, R., Playford, C. J., Gayle, V., & Dibben, C. (2016). The role of administrative data in the big data revolution in social science research. Social Science Research, 59, 1–12. https://doi.org/10.1016/j.ssresearch.2016.04.015
Fisher, R. A. (1935). The design of experiments. Oliver and Boyd.
Ginsberg, J., Mohebbi, M. H., Patel, R. S., Brammer, L., Smolinski, M. S., & Brilliant, L. (2009). Detecting influenza epidemics using search engine query data. Nature, 457(7232), 1012–1014. https://doi.org/10.1038/nature07634
Gitelman, L. (Ed.). (2013). "Raw data" is an oxymoron. MIT Press.
Groves, R. M. (2011). Three eras of survey research. Public Opinion Quarterly, 75(5), 861–871. https://doi.org/10.1093/poq/nfr057
Groves, R. M., Fowler, F. J., Jr., Couper, M. P., Lepkowski, J. M., Singer, E., & Tourangeau, R. (2009). Survey methodology (2nd ed.). Wiley.
Hakim, C. (1982). Secondary analysis in social research: A guide to data sources and methods with examples. George Allen & Unwin.
Hand, D. J. (2018). Statistical challenges of administrative and transaction data. Journal of the Royal Statistical Society: Series A (Statistics in Society), 181(3), 555–605. https://doi.org/10.1111/rssa.12315
Heaton, J. (2004). Reworking qualitative data. SAGE.
Hox, J. J., & Boeije, H. R. (2005). Data collection, primary versus secondary. In K. Kempf-Leonard (Ed.), Encyclopedia of social measurement (Vol. 1, pp. 593–599). Elsevier. https://doi.org/10.1016/B0-12-369398-5/00041-4
Japec, L., Kreuter, F., Berg, M., Biemer, P., Decker, P., Lampe, C., Lane, J., O'Neil, C., & Usher, A. (2015). Big data in survey research: AAPOR task force report. Public Opinion Quarterly, 79(4), 839–880. https://doi.org/10.1093/poq/nfv039
Kitchin, R. (2014). The data revolution: Big data, open data, data infrastructures and their consequences. SAGE.
Kreuter, F. (Ed.). (2013). Improving surveys with paradata: Analytic uses of process information. Wiley. https://doi.org/10.1002/9781118596869
Lazer, D., Kennedy, R., King, G., & Vespignani, A. (2014). The parable of Google Flu: Traps in big data analysis. Science, 343(6176), 1203–1205. https://doi.org/10.1126/science.1248506
Leonelli, S. (2016). Data-centric biology: A philosophical study. University of Chicago Press.
Meng, X.-L. (2018). Statistical paradises and paradoxes in big data (I): Law of large populations, big data paradox, and the 2016 US presidential election. The Annals of Applied Statistics, 12(2), 685–726. https://doi.org/10.1214/18-AOAS1161SF
Neyman, J. (1934). On the two different aspects of the representative method: The method of stratified sampling and the method of purposive selection. Journal of the Royal Statistical Society, 97(4), 558–625. https://doi.org/10.2307/2342192
Salganik, M. J. (2018). Bit by bit: Social research in the digital age. Princeton University Press.
Shadish, W. R., Cook, T. D., & Campbell, D. T. (2002). Experimental and quasi-experimental designs for generalized causal inference. Houghton Mifflin.
Squire, P. (1988). Why the 1936 Literary Digest poll failed. Public Opinion Quarterly, 52(1), 125–133. https://doi.org/10.1086/269085
Tukey, J. W. (1977). Exploratory data analysis. Addison-Wesley.