
Surveys · Questionnaire design
Visual Design of Web Surveys: Layout, Colour and Response Behaviour
In a web survey, respondents read meaning into everything they see, not just the words. This article explains how layout, spacing, colour, images, answer formats and progress indicators shape answers, and how to design screens that measure what they are meant to.
In an interview, the questions reach respondents through the interviewer's voice. In a web survey, they reach respondents through a screen, and everything on that screen communicates. The position of an answer option, the space between options, the colour of a scale, the size of a text box and the image at the top of the page all carry information that respondents use, often without noticing, to decide what a question means and how to answer it. Visual design is therefore not decoration. It is part of the measurement.
This article explains how respondents interpret what they see, reviews the main findings about layout, colour, images and answer formats, and sets out practical guidance for designing web survey screens.
Respondents read more than words
Survey researchers distinguish several kinds of language through which a self-completed questionnaire communicates. Verbal language is the words of the question and answers. Numeric language is the numbers attached to answer options. Symbolic language includes arrows and other symbols. Graphical language includes size, brightness, colour, shape, position and spacing (Christian & Dillman, 2004; Jenkins & Dillman, 1997). Respondents use all of these, and when they conflict, the non-verbal elements can change how the words are understood.
Building on this idea, Tourangeau and colleagues proposed that respondents apply simple interpretive heuristics to visual features when they answer web questions (Tourangeau et al., 2004).
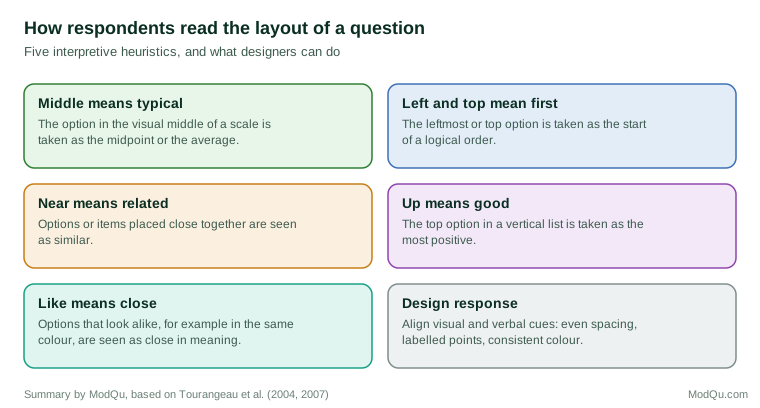
In experiments, these heuristics had measurable effects. When the visual midpoint of a scale did not coincide with its conceptual midpoint, for example because "don't know" options were placed at the end and shifted the visual centre, answers shifted towards the visual middle. When items were presented one per screen rather than together on a grid, correlations between them were lower, consistent with the idea that items placed near each other are seen as related (Tourangeau et al., 2004).
Layout and spacing
Spacing of answer options
Unequal spacing between scale options changes answers. Respondents treat the visual layout of a scale as information about the distances between its points (Tourangeau et al., 2004). Answer options should be evenly spaced, and any non-substantive options, such as "don't know", should be visually separated from the substantive scale so that they do not change its apparent centre.
Grouping and alignment
Principles of visual perception, such as the tendency to see items that are close together or that look alike as belonging together, apply to survey screens. Grouping related answer options, using consistent alignment and placing headings above the options they describe all help respondents see the structure of a question (Smyth et al., 2006). Answer options displayed in a single column are generally easier to read than options spread across several columns, which respondents may read in different orders.
Size of answer boxes
The size of a text box signals how much is expected. Larger boxes for open questions produce longer answers, and boxes designed for specific formats, such as separate boxes for month and year, produce answers in the correct format more often (Christian et al., 2007; Smyth et al., 2009). Labelling a box with the unit required, such as "years", further improves the format of answers.
Colour
Colour can change how respondents interpret a scale. In experiments in which the end points of a scale were shown in different colours, or in shades of the same colour, respondents interpreted the scale differently: when both ends were in different hues, respondents treated the scale points as more distinct, and answers shifted (Tourangeau et al., 2007). The effect was reduced when every point on the scale had a verbal label, which suggests that respondents rely on visual cues most when verbal information is limited.
For practical design, the lesson is to use colour consistently and with restraint. Colour is useful for distinguishing instructions from questions or for marking errors, but colouring answer options can introduce meanings the designer did not intend. Colour should also never be the only way of conveying information, because many respondents have some form of colour blindness.
Images
Images make surveys more attractive, but they also affect answers. In an experiment in which a question about how often respondents went shopping was accompanied by a picture of either a busy shopping mall or a single grocery purchase, respondents reported different frequencies depending on the picture they saw (Couper et al., 2004a). Images can also act as a standard of comparison: respondents who saw a picture of a fit, healthy woman rated their own health lower than those who saw a picture of a sick woman in a hospital bed (Couper et al., 2007).
Images should therefore be used only when they serve a measurement purpose, such as showing a product or an advertisement to be evaluated. Decorative images placed near questions are a potential source of bias.
Answer formats
Radio buttons, drop-down lists and sliders
Web surveys offer several ways of recording answers. Radio buttons show all options at once and are suitable for most closed questions. Drop-down lists save space but hide options until the respondent opens the list, and the options visible initially are chosen more often (Couper et al., 2004b). Drop-downs also take more effort to use (Healey, 2007). Sliders, which respondents drag along a line, appear modern but have been found to increase break-off and to be harder for respondents with less education (Funke et al., 2011).
Grids
Grids, in which several items share the same answer scale, save space and time but encourage straightlining, in which respondents give the same answer to every item. Breaking long grids into smaller ones or presenting items one at a time can improve data quality, especially on smartphones (Couper et al., 2013; Toepoel et al., 2009).
Check-all-that-apply versus forced choice
Lists in which respondents tick all options that apply produce fewer selections than the same items asked as separate yes/no questions. Respondents tend to stop reading or ticking after the first few options in a check-all list. The forced-choice format, which asks for an answer to each item, produces more selections and is generally considered more accurate (Smyth et al., 2006).
Navigation and progress
Paging and scrolling
A web survey can present questions one screen at a time (paging) or on a single long page (scrolling). Paging allows automatic routing and validation and is now the norm. Scrolling designs can be faster to complete but make routing more difficult (Peytchev et al., 2006).
Progress indicators
Progress indicators tell respondents how much of the survey remains. It might be expected that they always help, but the evidence is mixed. A meta-analysis of experiments found that progress indicators that moved at a constant rate did not reduce break-off on average, indicators that moved quickly at the start reduced it and indicators that moved slowly at the start increased it (Villar et al., 2013). An indicator that suggests the survey is longer than respondents expected can encourage them to stop (Conrad et al., 2010).
Error messages and validation
Web surveys can check answers as they are entered, for example by warning respondents when a number is out of range or a required question has been skipped. Validation improves data quality when it is used for genuine errors, but it can annoy respondents and increase break-off when it is used to force answers. A polite message that explains the problem and allows the respondent to continue is usually better than a hard block. Messages should appear next to the question they refer to and use a consistent colour and position, so that respondents learn to notice them (Couper, 2008).
Mobile screens
A growing share of web survey respondents answer on smartphones, and a layout designed for a large screen may look very different on a small one. Horizontal scales may be cut off or squeezed, grids may require sideways scrolling and small radio buttons may be hard to tap. Because visual cues shape answers, these changes can affect measurement as well as convenience. Survey software that adapts the layout to the screen solves some problems, but it can also create differences between devices, for example when a grid shown on a computer becomes a series of separate questions on a phone. Designers should check how each question looks on the smallest screen likely to be used and, where possible, choose formats that look similar across devices, such as vertical lists of options (Couper et al., 2013).
Practical guidance
- Treat every visual element as part of the question.
- Space scale points evenly and separate non-substantive options visually.
- Label all scale points with words where possible.
- Use colour consistently and sparingly; do not colour answer options without a reason.
- Avoid decorative images near questions.
- Prefer radio buttons to drop-downs for short lists, and test sliders before using them.
- Break long grids into smaller blocks.
- Size and label text boxes to match the expected answer.
- Test the design on every type of device respondents will use.
In business surveys
Commercial survey platforms offer many visual features: themes, colourful buttons, sliders, star ratings, images and animations. These can make surveys more engaging, but they also introduce visual cues that may change answers. A star rating scale and a numbered scale of the same length may not produce the same results, and a brand logo at the top of a satisfaction survey may influence ratings. When survey results are compared over time, the visual design should be kept consistent, because a change of template can produce a change in results that has nothing to do with customers' opinions (Dillman et al., 2014).
Conclusion
Web survey respondents interpret everything they see. Layout, spacing, colour, images, answer formats and progress indicators all shape their understanding of the questions and the answers they give. Good visual design aligns these cues with the intended meaning of the question: even spacing, consistent colour, appropriate answer formats and no unnecessary images. Because visual effects can be subtle, design choices should be based on evidence and tested before launch (Couper, 2008; Tourangeau et al., 2013).
References
Christian, L. M., & Dillman, D. A. (2004). The influence of graphical and symbolic language manipulations on responses to self-administered questions. Public Opinion Quarterly, 68(1), 57–80. https://doi.org/10.1093/poq/nfh004
Christian, L. M., Dillman, D. A., & Smyth, J. D. (2007). Helping respondents get it right the first time: The influence of words, symbols, and graphics in web surveys. Public Opinion Quarterly, 71(1), 113–125. https://doi.org/10.1093/poq/nfl039
Conrad, F. G., Couper, M. P., Tourangeau, R., & Peytchev, A. (2010). The impact of progress indicators on task completion. Interacting with Computers, 22(5), 417–427. https://doi.org/10.1016/j.intcom.2010.03.001
Couper, M. P. (2008). Designing effective web surveys. Cambridge University Press. https://doi.org/10.1017/CBO9780511499371
Couper, M. P., Conrad, F. G., & Tourangeau, R. (2007). Visual context effects in web surveys. Public Opinion Quarterly, 71(4), 623–634. https://doi.org/10.1093/poq/nfm044
Couper, M. P., Tourangeau, R., & Kenyon, K. (2004a). Picture this! Exploring visual effects in web surveys. Public Opinion Quarterly, 68(2), 255–266. https://doi.org/10.1093/poq/nfh013
Couper, M. P., Tourangeau, R., Conrad, F. G., & Crawford, S. D. (2004b). What they see is what we get: Response options for web surveys. Social Science Computer Review, 22(1), 111–127. https://doi.org/10.1177/0894439303256555
Couper, M. P., Tourangeau, R., Conrad, F. G., & Zhang, C. (2013). The design of grids in web surveys. Social Science Computer Review, 31(3), 322–345. https://doi.org/10.1177/0894439312469865
Dillman, D. A., Smyth, J. D., & Christian, L. M. (2014). Internet, phone, mail, and mixed-mode surveys: The tailored design method (4th ed.). Wiley.
Funke, F., Reips, U.-D., & Thomas, R. K. (2011). Sliders for the smart: Type of rating scale on the web interacts with educational level. Social Science Computer Review, 29(2), 221–231. https://doi.org/10.1177/0894439310376896
Healey, B. (2007). Drop downs and scroll mice: The effect of response option format and input mechanism employed on data quality in web surveys. Social Science Computer Review, 25(1), 111–128. https://doi.org/10.1177/0894439306293888
Jenkins, C. R., & Dillman, D. A. (1997). Towards a theory of self-administered questionnaire design. In L. Lyberg, P. Biemer, M. Collins, E. de Leeuw, C. Dippo, N. Schwarz, & D. Trewin (Eds.), Survey measurement and process quality (pp. 165–196). Wiley.
Peytchev, A., Couper, M. P., McCabe, S. E., & Crawford, S. D. (2006). Web survey design: Paging versus scrolling. Public Opinion Quarterly, 70(4), 596–607. https://doi.org/10.1093/poq/nfl028
Smyth, J. D., Dillman, D. A., Christian, L. M., & McBride, M. (2009). Open-ended questions in web surveys: Can increasing the size of answer boxes and providing extra verbal instructions improve response quality? Public Opinion Quarterly, 73(2), 325–337. https://doi.org/10.1093/poq/nfp029
Smyth, J. D., Dillman, D. A., Christian, L. M., & Stern, M. J. (2006). Comparing check-all and forced-choice question formats in web surveys. Public Opinion Quarterly, 70(1), 66–77. https://doi.org/10.1093/poq/nfj007
Toepoel, V., Das, M., & van Soest, A. (2009). Design of web questionnaires: The effects of the number of items per screen. Field Methods, 21(2), 200–213. https://doi.org/10.1177/1525822X08330261
Tourangeau, R., Conrad, F. G., & Couper, M. P. (2013). The science of web surveys. Oxford University Press. https://doi.org/10.1093/acprof:oso/9780199747047.001.0001
Tourangeau, R., Couper, M. P., & Conrad, F. (2004). Spacing, position, and order: Interpretive heuristics for visual features of survey questions. Public Opinion Quarterly, 68(3), 368–393. https://doi.org/10.1093/poq/nfh035
Tourangeau, R., Couper, M. P., & Conrad, F. (2007). Color, labels, and interpretive heuristics for response scales. Public Opinion Quarterly, 71(1), 91–112. https://doi.org/10.1093/poq/nfl046
Villar, A., Callegaro, M., & Yang, Y. (2013). Where am I? A meta-analysis of experiments on the effects of progress indicators for web surveys. Social Science Computer Review, 31(6), 744–762. https://doi.org/10.1177/0894439313497468