
Surveys · Questionnaire design
Questionnaire Length and Respondent Burden: Finding the Optimal Size
Longer questionnaires collect more information but cost participation and data quality. This article explains what respondent burden is, what the evidence shows about length, and how to decide how long a survey should be.
Every survey designer faces the same tension. Each additional question adds information that someone wants, and there is rarely a shortage of people who want more. But each additional question also adds to the effort asked of respondents, and respondents are volunteers. Ask too much and fewer people agree to take part, more give up before the end and those who finish give less careful answers. The question is not whether length matters, but how much it matters and how to find a sensible balance.
This article explains the idea of respondent burden, reviews what research shows about the effects of questionnaire length and describes practical ways to keep a survey as short as its purpose allows.
What respondent burden means
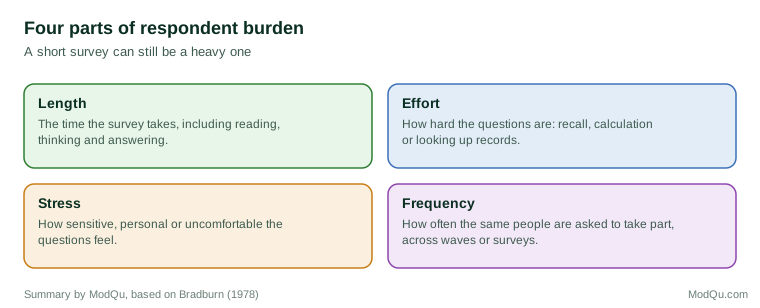
Length is the most visible part of burden, but it is not the whole of it. In an influential paper, Bradburn (1978) described respondent burden as having four parts: the length of the interview, the amount of effort required of the respondent, the amount of stress the respondent experiences and the frequency with which the respondent is asked to take part. A short survey can still be burdensome if its questions are difficult, intrusive or repetitive, and a longer survey can feel light if its questions are easy and interesting.
Burden is also partly subjective. What matters for behaviour is how burdensome the survey feels to the respondent, and this depends on interest in the topic, the clarity of the questions and the sense that the effort is worthwhile. In an early study of interviews of different lengths, respondents' sense of burden was related less to actual length than to their attitudes towards surveys and the topic (Sharp & Frankel, 1983). In web surveys, respondents' perceptions of burden, including how long they expected the survey to take, affected whether they started and completed it (Crawford et al., 2001). Later research has continued to distinguish between objective measures, such as minutes, and the burden respondents actually perceive (Yan et al., 2020).
How length affects participation
Agreeing to take part
When respondents are told in advance how long a survey will take, longer stated lengths tend to reduce the number who start. In a web survey experiment in which the stated length was varied at random, fewer people started the survey when they were told it would take longer (Galesic & Bosnjak, 2009). In mail surveys, a systematic review of experiments found that shorter questionnaires produced higher response rates on average (Edwards et al., 2002). Not every study finds a large effect: in an experiment with mail questionnaires of different lengths, the effect of length on response was modest (Burchell & Marsh, 1992), and the size of the effect depends on the population, the topic and the mode. A census test found that a shorter, respondent-friendly form produced a higher response rate than a longer one (Dillman et al., 1993).
Finishing the survey
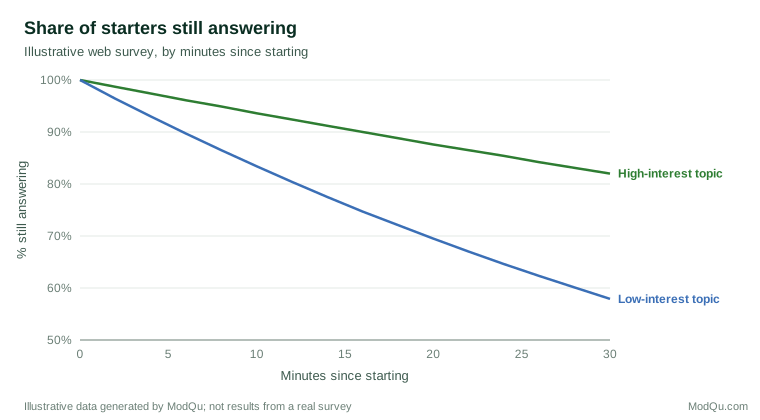
Length has a clearer effect on whether people finish. In web surveys, where respondents can stop at any time, break-off rises as the survey goes on. Analyses of break-off show that it is concentrated at particular kinds of questions, such as long grids and open questions, and that it increases with the time already spent (Peytchev, 2009). Studies of online research have found steady dropout as surveys become longer (Hoerger, 2010), and interest in the topic and the burden experienced during the survey both predict whether people drop out (Galesic, 2006).
Who drops out
Dropout is not random. If the people who give up are those with less interest in the topic, less time or lower literacy, the remaining sample differs from the population in ways that may bias the results. Long surveys therefore affect not only the quantity of data but also how well the people who complete them represent the population.
How length affects data quality
Satisficing
Even respondents who complete a long survey may not answer it with the same care throughout. Answering a survey question well requires understanding it, recalling relevant information, forming a judgement and reporting it. Krosnick (1991) argued that when motivation or ability falls, respondents begin to satisfice: to give answers that are good enough rather than optimal. Signs of satisficing include choosing the first reasonable option, agreeing with statements regardless of content, choosing "don't know" and giving the same answer to every item in a grid, known as straightlining.
Fatigue reduces motivation, so satisficing tends to increase as surveys go on. In an early study of a long questionnaire completed by high school students, items placed late in the questionnaire received more identical answers in a row and more missing answers than the same items placed earlier (Herzog & Bachman, 1981). In the web survey experiment mentioned above, questions placed later were answered faster, with shorter answers to open questions and less variation in grid answers (Galesic & Bosnjak, 2009). Grid questions are particularly vulnerable, and designs that reduce their cognitive demands can reduce satisficing (Roßmann et al., 2018).
The evidence overall
A review and meta-analysis of questionnaire length in health research found that longer questionnaires were associated with lower response rates, although the relationship was not simple and the quality of the evidence was mixed (Rolstad et al., 2011). The general conclusion of the literature is that length has costs for both participation and data quality, that the costs grow as surveys get longer and that their size depends heavily on topic, population and design.
Order matters as much as length
Because care declines as the survey goes on, the position of a question affects the quality of its answers. Questions that matter most for the analysis should come early, while respondents are still fresh, and demanding tasks such as long grids or open questions should not be left until the end (Galesic & Bosnjak, 2009). Demographic questions, which are easy to answer, can safely be placed near the end. When a survey must be long, rotating the order of modules across respondents spreads the effects of fatigue evenly, so that no single topic always receives the most tired answers.
Burden beyond the single survey
Burden also accumulates across surveys. People who belong to online panels or who are customers of many organisations may receive several invitations a week. Each one adds to their sense that surveys are a chore, and this affects how they respond to the next request. Frequency is the part of burden most often overlooked, because each organisation sees only its own surveys. Researchers who survey the same population repeatedly should track how often individuals are invited and set limits, for example no more than one invitation per customer per quarter.
The cost of burden is also borne by the research system as a whole. Response rates to many kinds of survey have fallen over several decades, and one explanation is that people are asked to take part in more surveys than in the past. Keeping each survey short and relevant is therefore partly a matter of protecting the willingness of the public to answer surveys in the future (Groves et al., 2009).
How long is too long?
There is no single correct length. Respondents' tolerance depends on their interest in the topic, their relationship with the organisation conducting the survey, any incentive offered and the mode. Interviewer surveys can usually hold respondents for longer than self-completed surveys, because the interviewer maintains engagement.
For web surveys, some studies have asked respondents directly. Members of online panels, asked how long they thought a survey should be, gave a median ideal length of around ten minutes and a maximum of around twenty (Revilla & Ochoa, 2017). In a study of web surveys in a commercial setting, response rates and response quality were compared for shorter and longer versions of the same questionnaire, and the longer version produced fewer responses (Deutskens et al., 2004). Respondents with low interest in the topic were more affected by length, and incentives partly made up for it (Marcus et al., 2007).
These findings suggest a useful rule of thumb for general web surveys: aim for ten minutes or less, treat twenty minutes as an upper limit for most audiences and expect the costs of length to be higher when the topic is of little interest to respondents.
Reducing length without losing information
Ask only what will be used
The most effective way to shorten a survey is to remove questions that will not be used. A useful discipline is to require that every question be linked to a specific research question or analysis. Questions that are "nice to know" rather than needed are the first candidates for removal (Dillman et al., 2014).
Use routing
Skip logic ensures that respondents see only the questions that apply to them. A survey with many questions can still be short for each respondent if routing is used well.
Simplify difficult questions
Effort is part of burden. Questions that require detailed recall, calculations or looking up records take longer and feel more demanding. Simplifying them, or replacing them with linked records where respondents consent, reduces burden without reducing length on paper (Tourangeau et al., 2000).
Split the questionnaire
When a long list of questions is genuinely needed, not every respondent needs to answer every question. In a split questionnaire design, the questionnaire is divided into modules, each respondent receives the core module plus a random selection of the others and statistical methods are used to combine the results (Raghunathan & Grizzle, 1995). This reduces burden for each respondent while still collecting information on all topics, at the cost of more complex analysis.
Spread the burden over time
In panel surveys, questions can be distributed across waves rather than asked all at once. This lowers burden per wave, although it increases frequency, the fourth part of burden in the framework set out by Bradburn (1978).
Improve design
Good visual design, clear instructions and a smooth flow make a survey feel shorter and easier (Couper, 2008). A progress indicator can help respondents judge how much remains, though its effect on completion depends on how quickly it appears to move.
In business surveys
Market research and customer feedback surveys are particularly prone to growing too long, because many departments want to add questions. The result is often a long questionnaire sent to customers who have little interest in the topic and no obligation to respond, which is the combination that produces the highest costs of length.
A practical approach is to agree on a time budget before writing questions, such as eight minutes for a customer satisfaction survey, and to test every proposed question against it. A pilot test measures the actual median time, which is usually longer than designers expect. Questions that do not fit within the budget can be rotated across survey waves or asked of a random subset of respondents. Short, frequent surveys sent to different customers often produce better information than long surveys sent to everyone, provided that individual customers are not invited too often.
An example
The way length is communicated also matters. Respondents who are told a survey will take ten minutes and find that it takes twenty are more likely to give up and less likely to take part in the next survey. An honest estimate, based on the median time in a pilot, is both more ethical and more effective than an optimistic one.
Consider a customer survey that started at 45 questions with a median completion time of 19 minutes in the pilot (illustrative figures). Reviewing every question against the analysis plan removes eight questions that no one had planned to use. Routing removes a further section on product support for customers who have not contacted support. Two long grids are reduced to their most important items. A module on future product ideas is moved to a split design, shown to a random third of respondents. The result is a median completion time of 10 minutes, with all core analyses still possible.
Checklist
- Link every question to a specific analysis or decision.
- Agree a time budget before drafting questions.
- Count effort and sensitivity, not just the number of questions.
- Use routing so that respondents see only relevant questions.
- Measure the real median length in a pilot.
- Put the most important questions early, before fatigue sets in.
- Consider split questionnaires or rotation for lower-priority topics.
- Monitor break-off and straightlining in the data.
- Tell respondents honestly how long the survey will take.
Conclusion
Length affects who takes part, who finishes and how carefully they answer. Its costs are real but vary with topic, population and mode, and burden includes effort, stress and frequency as well as minutes. The optimal size of a questionnaire is the shortest one that answers the questions the survey exists to answer. Getting there requires discipline about what to ask, careful design of how it is asked and measurement in a pilot of how long it actually takes (Groves et al., 2009).
References
Bradburn, N. (1978). Respondent burden. In Proceedings of the Survey Research Methods Section (pp. 35–40). American Statistical Association.
Burchell, B., & Marsh, C. (1992). The effect of questionnaire length on survey response. Quality & Quantity, 26(3), 233–244. https://doi.org/10.1007/BF00172427
Couper, M. P. (2008). Designing effective web surveys. Cambridge University Press. https://doi.org/10.1017/CBO9780511499371
Crawford, S. D., Couper, M. P., & Lamias, M. J. (2001). Web surveys: Perceptions of burden. Social Science Computer Review, 19(2), 146–162. https://doi.org/10.1177/089443930101900202
Deutskens, E., de Ruyter, K., Wetzels, M., & Oosterveld, P. (2004). Response rate and response quality of internet-based surveys: An experimental study. Marketing Letters, 15(1), 21–36. https://doi.org/10.1023/B:MARK.0000021968.86465.00
Dillman, D. A., Sinclair, M. D., & Clark, J. R. (1993). Effects of questionnaire length, respondent-friendly design, and a difficult question on response rates for occupant-addressed census mail surveys. Public Opinion Quarterly, 57(3), 289–304. https://doi.org/10.1086/269376
Dillman, D. A., Smyth, J. D., & Christian, L. M. (2014). Internet, phone, mail, and mixed-mode surveys: The tailored design method (4th ed.). Wiley.
Edwards, P., Roberts, I., Clarke, M., DiGuiseppi, C., Pratap, S., Wentz, R., & Kwan, I. (2002). Increasing response rates to postal questionnaires: Systematic review. BMJ, 324(7347), 1183. https://doi.org/10.1136/bmj.324.7347.1183
Galesic, M., & Bosnjak, M. (2009). Effects of questionnaire length on participation and indicators of response quality in a web survey. Public Opinion Quarterly, 73(2), 349–360. https://doi.org/10.1093/poq/nfp031
Galesic, M. (2006). Dropouts on the web: Effects of interest and burden experienced during an online survey. Journal of Official Statistics, 22(2), 313–328.
Groves, R. M., Fowler, F. J., Jr., Couper, M. P., Lepkowski, J. M., Singer, E., & Tourangeau, R. (2009). Survey methodology (2nd ed.). Wiley.
Herzog, A. R., & Bachman, J. G. (1981). Effects of questionnaire length on response quality. Public Opinion Quarterly, 45(4), 549–559. https://doi.org/10.1086/268687
Hoerger, M. (2010). Participant dropout as a function of survey length in Internet-mediated university studies: Implications for study design and voluntary participation in psychological research. Cyberpsychology, Behavior, and Social Networking, 13(6), 697–700. https://doi.org/10.1089/cyber.2009.0445
Krosnick, J. A. (1991). Response strategies for coping with the cognitive demands of attitude measures in surveys. Applied Cognitive Psychology, 5(3), 213–236. https://doi.org/10.1002/acp.2350050305
Marcus, B., Bosnjak, M., Lindner, S., Pilischenko, S., & Schütz, A. (2007). Compensating for low topic interest and long surveys: A field experiment on nonresponse in web surveys. Social Science Computer Review, 25(3), 372–383. https://doi.org/10.1177/0894439307297606
Peytchev, A. (2009). Survey breakoff. Public Opinion Quarterly, 73(1), 74–97. https://doi.org/10.1093/poq/nfp014
Raghunathan, T. E., & Grizzle, J. E. (1995). A split questionnaire survey design. Journal of the American Statistical Association, 90(429), 54–63. https://doi.org/10.1080/01621459.1995.10476488
Revilla, M., & Ochoa, C. (2017). Ideal and maximum length for a web survey. International Journal of Market Research, 59(5), 557–565. https://doi.org/10.2501/IJMR-2017-039
Rolstad, S., Adler, J., & Rydén, A. (2011). Response burden and questionnaire length: Is shorter better? A review and meta-analysis. Value in Health, 14(8), 1101–1108. https://doi.org/10.1016/j.jval.2011.06.003
Roßmann, J., Gummer, T., & Silber, H. (2018). Mitigating satisficing in cognitively demanding grid questions: Evidence from two web-based experiments. Journal of Survey Statistics and Methodology, 6(3), 376–400. https://doi.org/10.1093/jssam/smx020
Sharp, L. M., & Frankel, J. (1983). Respondent burden: A test of some common assumptions. Public Opinion Quarterly, 47(1), 36–53. https://doi.org/10.1086/268765
Tourangeau, R., Rips, L. J., & Rasinski, K. (2000). The psychology of survey response. Cambridge University Press. https://doi.org/10.1017/CBO9780511819322
Yan, T., Fricker, S., & Tsai, S. (2020). Response burden: What is it and what predicts it? In P. Beatty, D. Collins, L. Kaye, J. L. Padilla, G. Willis, & A. Wilmot (Eds.), Advances in questionnaire design, development, evaluation and testing (pp. 193–212). Wiley.