
Surveys · Questionnaire design
Asking About Income: Techniques for Sensitive Financial Questions
Income is one of the most useful survey variables and one of the hardest to collect. This article explains why income questions go unanswered or are answered inaccurately, and the techniques that improve both response and accuracy.
Income is one of the most useful variables in survey research. It is used to describe samples, to analyse differences in behaviour and attitudes, to weight results and to study inequality. It is also one of the hardest variables to collect. Income questions have some of the highest rates of item nonresponse in surveys, and the answers that are given contain substantial error (Moore et al., 2000). This article explains why income is difficult to measure and describes techniques that improve both the response rate and the accuracy of income questions.
Why income is hard to measure
Sensitivity
Many people regard their income as private. They may worry about how the information will be used, fear that it could reach tax authorities or simply feel that it is nobody else's business. Income questions are therefore a classic example of a sensitive question, and they attract both refusals and answers adjusted to seem more acceptable (Tourangeau & Yan, 2007). Refusals and "don't know" answers to income questions are associated with different respondent characteristics, which suggests that they reflect different reasons for not answering (Riphahn & Serfling, 2005). Studies of long-running surveys have found that income nonresponse has tended to rise over time (Yan et al., 2010).
Difficulty
Even willing respondents may not know the answer. Household income requires knowledge of every member's earnings, benefits, pensions and investment returns. Many employees know their take-home pay better than their gross salary; self-employed people may not know their income until their accounts are completed. Irregular sources, such as bonuses, interest or occasional work, are easily forgotten. Measurement error in income reports is well documented in comparisons with administrative records (Bound et al., 2001).
Ambiguity
"What is your income?" can be understood in many ways. It may mean the respondent's own income or the household's, before or after tax, from work only or from all sources, last year or this month. Different respondents will make different assumptions, and their answers will not be comparable.
Writing a clear income question
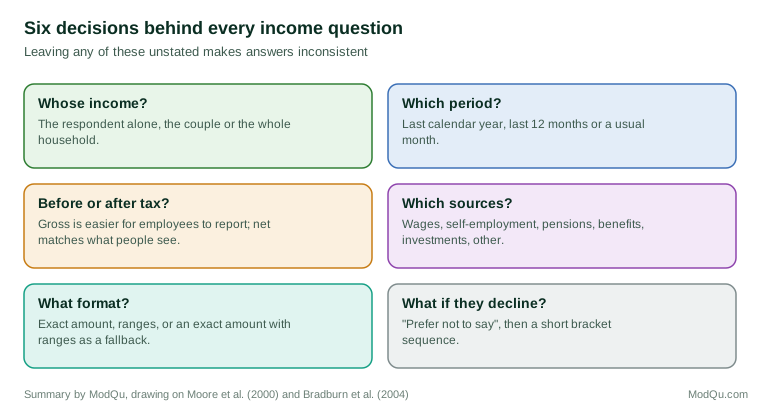
A good income question states the unit (person or household), the period, whether the amount is before or after tax and which sources to include (Bradburn et al., 2004). For example: "Thinking about the last 12 months, what was the total income of your household from all sources, before tax and other deductions? Please include wages and salaries, self-employment, pensions, government benefits and investment income."
Whether to ask a single question about total income or a series of questions about each source is an important choice. A single question is quick but relies on respondents to add up their income correctly. A series of questions about each source takes longer but prompts respondents to remember sources they would otherwise forget. Research comparing a single income question with income built up from detailed components found substantial differences for individual households, although the single question performed reasonably for some purposes (Micklewright & Schnepf, 2010).
Reducing nonresponse
Ranges instead of exact amounts
Many respondents who will not give an exact figure are willing to choose a range. Offering income bands, such as "$40,000 to $59,999," reduces nonresponse and is easier for respondents who know their income only approximately. The cost is a loss of precision, and the bands must be chosen so that they are exhaustive, do not overlap and fit the income distribution of the population.
Unfolding brackets
A combination of the two approaches asks first for an exact amount and then, if the respondent declines or does not know, asks a series of yes/no questions: "Is it more than $50,000?" "Is it more than $100,000?" This technique, known as unfolding brackets, was developed for economic surveys of older people and greatly reduced missing data on income and wealth (Juster & Smith, 1997). Bracket questions have a known weakness: the first threshold offered can act as an anchor, pulling answers towards it, so the starting values should be chosen with care (Hurd, 1999).
Explanation and reassurance
Respondents are more willing to answer when they understand why the question is asked and how their answer will be protected. A brief explanation ("We ask about income so that we can compare the views of people in different circumstances. Your answer is confidential and will only be reported in combination with others") can help. Placing income questions near the end of the questionnaire, after rapport has been built, is standard practice (Dillman et al., 2014).
Self-administration
People are more willing to report sensitive information when no interviewer is present (Tourangeau & Yan, 2007). In interviewer surveys, showing respondents a card with lettered income bands and asking them to give only the letter reduces the sense of disclosure.
Using records and linked data
Where accuracy matters most, respondents can be encouraged to consult documents such as payslips, tax returns or benefit statements before answering. Surveys of household finances often send a letter in advance asking respondents to have such documents ready. This improves accuracy for respondents who use them, though many do not.
An alternative is to link survey responses, with the respondent's consent, to administrative records such as tax or social security data. Linkage removes the burden of reporting and avoids recall error, and comparisons between survey reports and linked records are the main source of evidence about how accurate income reports are (Bound et al., 2001). Linkage raises its own issues, including consent rates, privacy protection and differences between the definitions of income used in records and in surveys.
Income questions in business surveys
Market research surveys often ask about income to segment customers or to check that the sample represents the target market. For these purposes, a short set of household income bands is usually enough, and precision beyond that is rarely needed. The bands should be chosen to match the market: a survey of luxury car buyers needs finer bands at the top of the income range than a survey of the general population, where most households fall in the middle bands. Bands should also match any external data used for comparison or weighting, such as census income categories, so that the sample can be checked against the population.
Because income is sensitive, business surveys should ask it only where it serves a clear purpose, and should always offer "prefer not to say." Asking for income in a short customer feedback survey that does not use it in analysis increases dropout and adds nothing to the results.
Dealing with missing income data
Even with good design, some income data will be missing. Simply dropping respondents who did not answer can bias results, because nonrespondents differ systematically from respondents. A study of a large health survey found that respondents with missing income differed on characteristics such as age, education and health, so that excluding them could distort analyses (Kim et al., 2007). The standard solution is imputation: estimating the missing values from other information about the respondent. Multiple imputation, which creates several plausible values to reflect uncertainty, is widely used for income in major surveys (Schenker et al., 2006; Little & Rubin, 2019). How income is imputed can noticeably affect estimates of inequality and income mobility, so imputation methods should be documented (Frick & Grabka, 2005).
Conclusion
Income questions fail for three reasons: respondents do not want to answer, cannot answer accurately or understand the question differently. Clear definitions of the unit, period, tax treatment and sources address the third problem. Detailed source questions, records and reasonable reference periods help with the second. Ranges, unfolding brackets, explanations, privacy and careful placement reduce the first. Where income is still missing, careful imputation is better than ignoring the problem.
References
Bound, J., Brown, C., & Mathiowetz, N. (2001). Measurement error in survey data. In J. J. Heckman & E. Leamer (Eds.), Handbook of econometrics (Vol. 5, pp. 3705–3843). Elsevier. https://doi.org/10.1016/S1573-4412(01)05012-7
Bradburn, N. M., Sudman, S., & Wansink, B. (2004). Asking questions: The definitive guide to questionnaire design for market research, political polls, and social and health questionnaires (Rev. ed.). Jossey-Bass.
Dillman, D. A., Smyth, J. D., & Christian, L. M. (2014). Internet, phone, mail, and mixed-mode surveys: The tailored design method (4th ed.). Wiley.
Frick, J. R., & Grabka, M. M. (2005). Item nonresponse on income questions in panel surveys: Incidence, imputation and the impact on inequality and mobility. Allgemeines Statistisches Archiv, 89(1), 49–61. https://doi.org/10.1007/s101820500191
Hurd, M. D. (1999). Anchoring and acquiescence bias in measuring assets in household surveys. Journal of Risk and Uncertainty, 19(1–3), 111–136. https://doi.org/10.1023/A:1007863122779
Juster, F. T., & Smith, J. P. (1997). Improving the quality of economic data: Lessons from the HRS and AHEAD. Journal of the American Statistical Association, 92(440), 1268–1278. https://doi.org/10.1080/01621459.1997.10473648
Kim, S., Egerter, S., Cubbin, C., Takahashi, E. R., & Braveman, P. (2007). Potential implications of missing income data in population-based surveys: An example from a postpartum survey in California. Public Health Reports, 122(6), 753–763. https://doi.org/10.1177/003335490712200607
Little, R. J. A., & Rubin, D. B. (2019). Statistical analysis with missing data (3rd ed.). Wiley. https://doi.org/10.1002/9781119482260
Micklewright, J., & Schnepf, S. V. (2010). How reliable are income data collected with a single question? Journal of the Royal Statistical Society: Series A (Statistics in Society), 173(2), 409–429.
Moore, J. C., Stinson, L. L., & Welniak, E. J., Jr. (2000). Income measurement error in surveys: A review. Journal of Official Statistics, 16(4), 331–361.
Riphahn, R. T., & Serfling, O. (2005). Item non-response on income and wealth questions. Empirical Economics, 30(2), 521–538. https://doi.org/10.1007/s00181-005-0247-7
Schenker, N., Raghunathan, T. E., Chiu, P.-L., Makuc, D. M., Zhang, G., & Cohen, A. J. (2006). Multiple imputation of missing income data in the National Health Interview Survey. Journal of the American Statistical Association, 101(475), 924–933.
Tourangeau, R., & Yan, T. (2007). Sensitive questions in surveys. Psychological Bulletin, 133(5), 859–883. https://doi.org/10.1037/0033-2909.133.5.859
Yan, T., Curtin, R., & Jans, M. (2010). Trends in income nonresponse over two decades. Journal of Official Statistics, 26(1), 145–164.