
Surveys · Nonresponse, weighting and data quality
Quality Control Protocols for Interviewer-Administered Surveys
Interviewers improve response and data quality, but they also introduce variation, error and occasionally fabrication. This article sets out the quality control protocols that keep interviewer-administered surveys reliable.
Interviewers are the survey's representatives at the doorstep and on the telephone. They persuade people to take part, explain questions, keep respondents engaged and record answers. They also introduce error. Different interviewers ask the same questions in slightly different ways, react differently to answers and obtain cooperation from different kinds of people. In rare cases they invent interviews. Quality control protocols are the procedures that prevent, detect and correct these problems. This article describes the main components.
Why interviewers matter for quality
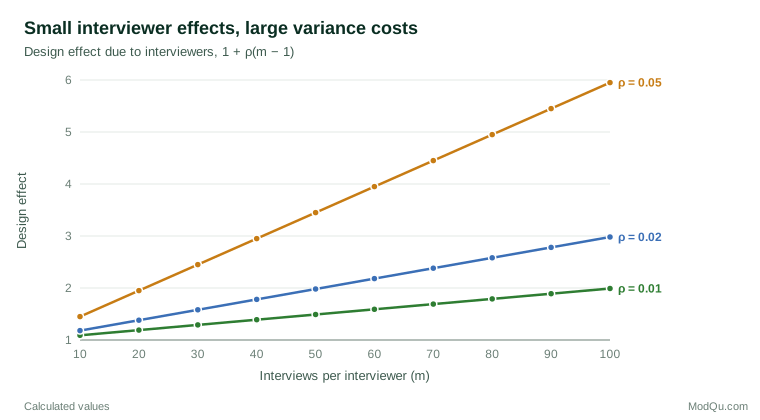
Kish (1962) showed that the answers collected by different interviewers vary more than random sampling alone would produce. Because each interviewer completes many interviews, even a small interviewer effect inflates the variance of estimates. The effect is usually summarised by the intra-interviewer correlation, ρint, the share of total variance attributable to interviewers. The resulting design effect is:
deffint = 1 + ρint (m − 1)
where m is the average number of interviews per interviewer. Groves and Magilavy (1986) found that ρint values in centralised telephone surveys were typically small, often around 0.01, but Figure 1 shows how quickly even small values inflate variance when interviewers have large workloads.
West and Blom (2017) reviewed research on interviewer effects and found that they arise in recruitment as well as measurement. Interviewers differ in their contact and cooperation rates, so they can affect who is in the sample as well as what respondents say. Effects tend to be larger for sensitive, ambiguous or open questions, and for questions that require interviewers to probe or explain (Mangione et al., 1992; Schaeffer et al., 2010).
Prevention: standardisation and training
The first line of quality control is prevention. Standardised interviewing aims to make every interview as similar as possible: interviewers read questions exactly as worded, probe non-directively, record answers verbatim and avoid giving personal opinions (Fowler & Mangione, 1990). Cannell et al. (1981) showed that techniques such as clear instructions to respondents, feedback on effort and commitment statements improved reporting.
Training should cover:
- the purpose of the survey and the meaning of each question;
- standard techniques for reading, probing, clarifying and recording;
- procedures for contacting households, selecting respondents and handling refusals;
- ethics, confidentiality and safeguarding;
- practice interviews with feedback, followed by a certification test.
Workloads matter too. Figure 1 shows that limiting the number of interviews per interviewer reduces the variance cost of interviewer effects. Olson and Peytchev (2007) found that interviewers conducted interviews faster as they gained experience within a survey, which may reduce data quality if not monitored.
Monitoring during fieldwork
Monitoring identifies problems while they can still be corrected. Biemer and Lyberg (2003) describe survey quality as the result of controlled processes, measured by indicators collected throughout fieldwork.
Live monitoring and recording. In telephone centres, supervisors listen to a sample of interviews and score them against a checklist. In face-to-face surveys, computer-assisted interviewing can record portions of interviews, with consent, for later review. Behaviour coding classifies interviewer actions, such as reading questions incorrectly or probing in a leading way.
Paradata. Computer-assisted systems record keystrokes, timings, call attempts and locations. Kreuter (2013) describes how such paradata can be used to monitor fieldwork. Unusually short interviews, interviews conducted at odd hours, long gaps between questions or identical timing patterns across interviews can signal problems.
Performance indicators. Response, contact and refusal rates, item nonresponse, the distribution of key answers and interview length are compared between interviewers. Interviewers whose results differ sharply from others working in similar areas are reviewed. Durrant et al. (2010) found that interviewers' attitudes and behaviour were associated with refusal rates, so monitoring can also guide coaching.
Telephone and face-to-face settings
Quality control is easier in a centralised telephone facility, where supervisors are present, interviews can be monitored in real time and work is distributed among interviewers at random. Random allocation also allows interviewer effects to be estimated cleanly, because each interviewer's respondents are comparable. Face-to-face surveys are harder to control. Interviewers work alone, often far from supervisors, and each covers particular areas, so differences between interviewers are mixed with differences between areas. Designs that assign interviewers to randomly selected areas, or that share areas between interviewers, allow the two to be separated. Supervisors in the field rely more on paradata, recordings, accompanied visits and re-contact checks.
A worked example
Suppose a hypothetical face-to-face survey uses 40 interviewers, each completing about 30 interviews. Weekly monitoring shows that one interviewer's interviews average 18 minutes, against 34 minutes for interviewers in similar areas; that the interviewer records almost no item nonresponse; and that answers to a series of attitude questions show very little variation. None of these facts proves misconduct. Together they justify review. Supervisors listen to recorded excerpts, re-contact a sample of the interviewer's respondents and compare timestamps with GPS records. If the review finds that sections were skipped, the interviewer is retrained, the affected cases are completed again or flagged, and the decision is recorded.
Detecting falsification
Falsification includes inventing whole interviews, filling in skipped questions, interviewing the wrong person or recording the wrong mode. It is rare but damaging. Detection methods include:
- Re-contact verification. A random sample of each interviewer's respondents is re-contacted to confirm that the interview took place and to repeat a few questions.
- Statistical screening. Fabricated data often differ from real data in their distributions. Bredl et al. (2012) showed that cluster analysis of indicators, such as the share of extreme answers, item nonresponse and the use of "other" options, can identify suspicious interviewers. Blasius and Thiessen (2012) describe methods for spotting duplicated patterns and implausibly simple response structures.
- Paradata checks. Timestamps and GPS coordinates can show whether interviews were conducted where and when they were reported.
Detected falsification should lead to the removal or replacement of affected cases, re-interviewing where possible, and documentation in the technical report.
Feedback and correction
Monitoring is useful only if it leads to action. Good protocols specify thresholds that trigger review, a process for giving interviewers prompt feedback and retraining, and escalation for repeated or serious problems. Supervisors should treat most deviations as training needs, not misconduct, because interviewers who fear punishment may hide problems.
Documentation
The final technical report should describe interviewer recruitment and training, monitoring rates, verification results, the number of cases removed and, where possible, estimates of interviewer effects. This information allows users to judge the quality of the data. Internally, the quality control record should be kept with the data so that later analysts can check whether results depend on particular interviewers, for example by fitting multilevel models with interviewer as a level or by repeating key analyses without suspect cases. Clients who commission interviewer-administered surveys should ask for this record as part of the deliverables.
Common mistakes
- Monitoring only response rates, which rewards interviewers who obtain interviews at any cost to data quality.
- Giving interviewers very large workloads, which multiplies the effect of each interviewer's habits.
- Verifying a fixed share of interviews only at the end of fieldwork, when problems can no longer be corrected.
- Treating indicators as proof of misconduct without review, which damages trust and morale.
- Leaving quality control out of the technical report.
Key takeaways
Interviewers bring large benefits to surveys, but they also add variance and, occasionally, deliberate error. A complete quality control protocol combines prevention through standardisation, training and manageable workloads; monitoring through recordings, paradata and performance indicators; detection of falsification through re-contact and statistical screening; prompt feedback; and transparent documentation.
References
Biemer, P. P., & Lyberg, L. E. (2003). Introduction to survey quality. Wiley. https://doi.org/10.1002/0471458740
Blasius, J., & Thiessen, V. (2012). Assessing the quality of survey data. Sage. https://doi.org/10.4135/9781446251874
Bredl, S., Winker, P., & Kötschau, K. (2012). A statistical approach to detect interviewer falsification of survey data. Survey Methodology, 38(1), 1–10.
Cannell, C. F., Miller, P. V., & Oksenberg, L. (1981). Research on interviewing techniques. Sociological Methodology, 12, 389–437. https://doi.org/10.2307/270748
Durrant, G. B., Groves, R. M., Staetsky, L., & Steele, F. (2010). Effects of interviewer attitudes and behaviors on refusal in household surveys. Public Opinion Quarterly, 74(1), 1–36. https://doi.org/10.1093/poq/nfp098
Fowler, F. J., Jr., & Mangione, T. W. (1990). Standardized survey interviewing: Minimizing interviewer-related error. SAGE.
Groves, R. M., & Magilavy, L. J. (1986). Measuring and explaining interviewer effects in centralized telephone surveys. Public Opinion Quarterly, 50(2), 251–266. https://doi.org/10.1086/268979
Kish, L. (1962). Studies of interviewer variance for attitudinal variables. Journal of the American Statistical Association, 57(297), 92–115. https://doi.org/10.1080/01621459.1962.10482153
Kreuter, F. (Ed.). (2013). Improving surveys with paradata: Analytic uses of process information. Wiley. https://doi.org/10.1002/9781118596869
Mangione, T. W., Fowler, F. J., Jr., & Louis, T. A. (1992). Question characteristics and interviewer effects. Journal of Official Statistics, 8(3), 293–307.
Olson, K., & Peytchev, A. (2007). Effect of interviewer experience on interview pace and interviewer attitudes. Public Opinion Quarterly, 71(2), 273–286. https://doi.org/10.1093/poq/nfm007
Schaeffer, N. C., Dykema, J., & Maynard, D. W. (2010). Interviewers and interviewing. In P. V. Marsden & J. D. Wright (Eds.), Handbook of survey research (2nd ed., pp. 437–470). Emerald.
West, B. T., & Blom, A. G. (2017). Explaining interviewer effects: A research synthesis. Journal of Survey Statistics and Methodology, 5(2), 175–211. https://doi.org/10.1093/jssam/smw024