
Surveys · Types and applications
Panel Surveys: Measuring Change in the Same People Over Time
Panel surveys interview the same people repeatedly, which allows researchers to measure individual change and its causes. This article explains the main types of panel design, their advantages over repeated cross-sections, and the special problems of attrition, panel conditioning and seam effects.
Most surveys take a snapshot: they interview a sample once and describe the population at that moment. Repeating the survey with a new sample each year shows how the population changes, but not how individuals change. If the poverty rate is the same in two years, it could be that the same people are poor in both years, or that half the poor escaped poverty and were replaced by others who fell into it. Only a panel survey, which interviews the same people repeatedly, can tell these situations apart (Duncan & Kalton, 1987).
Panel surveys, also called longitudinal surveys, are among the most valuable sources of social and economic data. They show how people's lives unfold: how they move in and out of work, poverty, ill health and relationships, and what happens before and after such changes. This article explains how panels are designed, what they offer and the special methodological problems they face (Kasprzyk et al., 1989; Lynn, 2009).
A short history
Repeated interviews with the same people have a long history in social research. Early election studies in the 1940s interviewed voters several times during a campaign to see how their intentions changed. The first large general-purpose panels started in the late 1960s, when the Panel Study of Income Dynamics began following American families to study poverty. Its success led to similar panels in many countries from the 1980s onwards, and to the harmonisation of several national panels so that they could be compared. The growth of the internet then made it possible to survey panel members much more often and more cheaply, leading to the probability-based online panels of the 2000s and later. Today, panel data from dozens of countries are used in thousands of studies each year.
Types of panel design
Panel surveys take several forms, summarised in Figure 1.
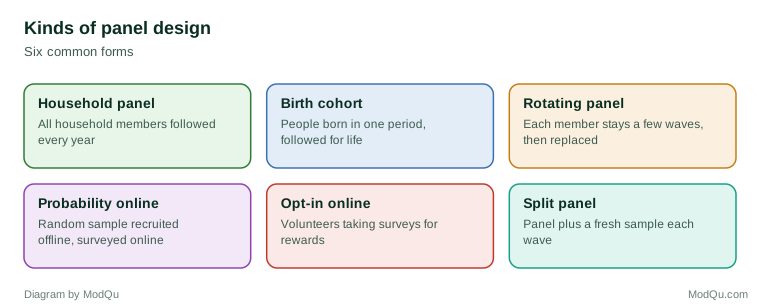
Household panels follow all members of a sample of households, and the people who later join their households, usually interviewing them every year. The Panel Study of Income Dynamics in the United States, started in 1968, is the longest-running example. Others include the German Socio-Economic Panel, the British Household Panel Survey and its successor Understanding Society, and the Household, Income and Labour Dynamics in Australia survey. Because they follow people who leave to form new households, these panels remain representative of the population over time, apart from immigration.
Cohort studies follow people born or starting school in a particular period. British birth cohort studies have followed people born in single weeks of 1946, 1958 and 1970 throughout their lives, and later cohorts follow children born around 2000 and later. Cohort studies show how early circumstances shape later outcomes.
Rotating panels keep each sample member for a limited number of waves, replacing a fraction of the sample each period. Labour force surveys often use this design, which provides precise estimates of change between adjacent periods while spreading the burden of response.
Probability-based online panels recruit a random sample of the population, often by post or in person, and invite members to complete short online questionnaires every month or so. Members without internet access may be given a device and a connection. Examples include the LISS panel in the Netherlands and the German Internet Panel (Scherpenzeel & Das, 2010; Blom et al., 2015). These panels provide fast, inexpensive data from a known sample and can be used both for repeated measures and for one-off studies.
Opt-in online panels, run by commercial companies, consist of people who volunteer to take surveys in return for small rewards. They are widely used for market research and are not usually designed to follow change in individuals, although their members can be re-interviewed (Callegaro et al., 2014).
Split panels combine a panel with a fresh cross-sectional sample each wave, so that the panel can measure individual change while the fresh sample guards against the problems of panels described below.
What panels can do that cross-sections cannot
Measuring gross change
A repeated cross-section shows net change, such as a fall in unemployment from 7 to 6 per cent. A panel also shows gross change: how many people moved from unemployment into work, how many moved the other way and how many stayed where they were. These flows are often more important for policy than the net figures. Panel data showed, for example, that most spells of poverty are short but that a minority of people remain poor for many years, a pattern that cross-sectional data cannot reveal.
Ordering events in time
Because panels observe the same people at several times, they show which came first: whether job loss preceded ill health or followed it, whether marriage preceded a rise in income or the other way around. Establishing the order of events is a necessary, though not sufficient, step towards understanding causes.
Controlling for unobserved differences
People differ in many ways that surveys cannot measure, such as ability, motivation and personality. When the same people are observed several times, statistical methods can compare each person with themselves at different times, removing the effects of characteristics that do not change. Fixed effects models do exactly this (Allison, 2009), and growth curve models describe how each person's outcomes change over time (Singer & Willett, 2003). These methods make panel data especially valuable for studying causes.
Greater precision for change
When the same people are measured twice, much of the variation between individuals cancels out in the comparison. Estimates of change from a panel are therefore usually much more precise than estimates from two independent samples of the same size.
The problems of panels
The advantages of panels come with specific problems that cross-sectional surveys do not face.
Attrition
Attrition is the loss of sample members over successive waves, because they cannot be found, cannot be contacted or decline to take part again. Even modest losses at each wave accumulate: if 90 per cent of the previous wave's respondents take part each year, only 59 per cent of the original sample remain after five years. Figure 2 shows how much difference retention efforts can make.
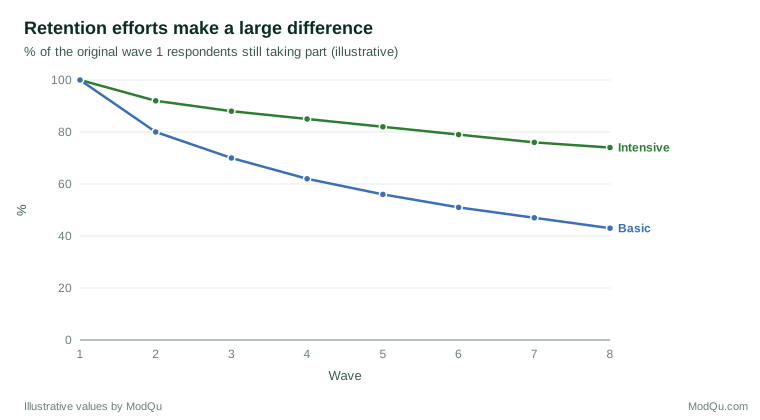
Attrition matters if those who drop out differ from those who remain. Studies of major panels have found that dropouts are more likely to be young, to move house, to rent, to be single and to have lower incomes (Watson & Wooden, 2009; Uhrig, 2008). Yet the effect on estimates is often smaller than these differences suggest. Fitzgerald et al. (1998) found that although the Panel Study of Income Dynamics had lost about half its original sample, estimates of relationships between key variables were little affected. Lugtig (2014) showed that panel members follow different patterns of participation, from loyal stayers to people who drop out quickly, gradually or intermittently, and that these groups differ in ways that matter for bias.
Panels reduce attrition in several ways (Laurie et al., 1999; Lynn, 2009):
- Keeping in touch between waves, through newsletters, birthday cards and requests to update contact details.
- Tracing people who move, using contact details of relatives and friends given at earlier waves and public records (Couper & Ofstedal, 2009).
- Incentives, often paid at every wave.
- Using the same interviewer where possible, so that respondents meet a familiar person.
- Offering several modes, such as web, telephone and face to face, so that people who cannot take part in one way can in another (Lynn, 2013).
- Re-approaching nonrespondents at later waves, since many who miss one wave will take part again.
Weighting adjusts for remaining attrition, using the rich information available from earlier waves about the people who dropped out. Because so much is known about them, panels can model and correct attrition more effectively than cross-sectional surveys can correct initial nonresponse.
Panel conditioning
Being interviewed repeatedly can change people's behaviour or their answers. This panel conditioning can take several forms. Respondents may become more interested in a topic because they have been asked about it, such as voting more after being asked about politics. They may learn that some answers lead to extra questions and avoid giving them. Or they may give more accurate answers as they become familiar with the questions and trust the interviewer more (Sturgis et al., 2009; Warren & Halpern-Manners, 2012).
The evidence is mixed. Some studies find clear effects, while others find little. Halpern-Manners et al. (2017) studied repeated interviews in the General Social Survey and found evidence of conditioning for some questions, particularly those on knowledge and on topics respondents had not thought much about before. Rotation group bias in labour force surveys, where reported unemployment differs according to how many times a household has been interviewed, is a long-recognised form of the problem (Bailar, 1975). Split-panel designs, in which a fresh sample is interviewed alongside the panel, allow conditioning to be measured.
Seam effects
Panels that ask about each month since the last interview show a characteristic pattern: changes in status, such as starting or stopping a benefit, are reported far more often between the last month of one reference period and the first month of the next than between months within the same period. This seam effect arises because respondents tend to report the same status for every month within a period and because answers in different interviews are not consistent with each other (Kalton et al., 1989).
Dependent interviewing reduces seam effects. Instead of asking each question afresh, the interviewer reminds the respondent of their answer at the previous interview, for example "Last time, you told us you were receiving housing benefit. Are you still receiving it?" Experiments have shown that this reduces spurious changes and improves the consistency of reports (Jäckle, 2009; Lynn et al., 2006).
Keeping the panel representative
A panel selected at one point represents the population of that time. Over the years, the population changes through immigration, births and deaths, while the panel ages. Household panels follow new household members and children born into sample households, but immigrants who arrive after the panel started are not covered. Many long-running panels therefore add refreshment samples from time to time, which also replace sample size lost through attrition (Kalton & Citro, 1993).
Designing questionnaires for the long term
A panel questionnaire must serve two purposes that pull in different directions. To measure change, questions must stay the same from wave to wave, because even small changes in wording can create apparent changes in the answers. But the world changes too: new technologies, new benefits and new social issues appear, and questions written decades ago may become dated or meaningless. Panels handle this tension in several ways.
Most panels keep a core of questions asked at every wave, covering the main topics such as employment, income, health and household composition, and add rotating modules on other topics every few years. When a core question must change, the old and new versions may be asked to random halves of the sample for a period, so that the effect of the change can be measured and the series bridged. Changes of mode raise the same issue. Many panels that began with face-to-face interviews now use the web for some or all respondents, and the move needs careful testing to separate mode effects from real change (Lynn, 2013).
Questionnaire length is also a concern. Respondents who find an interview long or tedious are less likely to take part at the next wave, so the burden of each wave affects the survival of the whole panel. Designers therefore weigh every new question against its cost in future participation.
Analysing panel data
Panel data need analysis methods that reflect their structure. Repeated observations on the same person are not independent, so standard errors must account for clustering within individuals. Weights must suit the analysis: a cross-sectional weight for estimates at a single wave, and a longitudinal weight, for people who responded at every wave in question, for analyses of change. Methods for missing data, such as multiple imputation, can use information from other waves to fill gaps. Models such as fixed effects, random effects and growth curves allow researchers to separate stable differences between people from change within them (Singer & Willett, 2003; Allison, 2009).
Costs and ethics
Panels are expensive. Tracing, keeping in touch, paying incentives at every wave and maintaining a dedicated team over many years all add to the cost. But each wave builds on everything collected before, so the value of a panel grows over time, and many of the most cited data sets in the social sciences are long-running panels.
Panels also raise particular ethical issues. Participants give their time repeatedly, sometimes over decades, and their trust must be maintained. They must be free to withdraw at any time. Contact information held for tracing must be protected. And the accumulation of detailed information about the same people over many years increases the risk that they could be identified, so access to panel data is carefully controlled.
An example
A research institute sets up a panel of 5,000 households to study how people's finances change. At wave 1, 4,000 households take part. The institute keeps in touch by sending a short annual report of findings and a birthday card, pays a small incentive at every wave and lets respondents choose between web and telephone. By wave 6, 2,900 of the original households still take part, about 73 per cent. Analysis of who dropped out shows that renters and young adults are over-represented among dropouts, so longitudinal weights are adjusted using wave 1 information. The panel shows that 30 per cent of households experienced at least one year in financial difficulty during the six years, although only 12 per cent were in difficulty in any single year, a pattern that a cross-sectional survey could not have revealed (illustrative example).
Conclusion
Panel surveys follow the same people over time, revealing individual change, the order of events and the paths people take through life. They support analysis of causes that cross-sectional surveys cannot. Their value depends on managing attrition, recognising panel conditioning and seam effects, and keeping the panel representative as the population changes. Well-run panels are among the most powerful tools in survey research.
References
Allison, P. D. (2009). Fixed effects regression models. SAGE. https://doi.org/10.4135/9781412993869
Bailar, B. A. (1975). The effects of rotation group bias on estimates from panel surveys. Journal of the American Statistical Association, 70(349), 23–30. https://doi.org/10.1080/01621459.1975.10480255
Blom, A. G., Gathmann, C., & Krieger, U. (2015). Setting up an online panel representative of the general population: The German Internet Panel. Field Methods, 27(4), 391–408. https://doi.org/10.1177/1525822X15574494
Callegaro, M., Baker, R., Bethlehem, J., Göritz, A. S., Krosnick, J. A., & Lavrakas, P. J. (Eds.). (2014). Online panel research: A data quality perspective. Wiley. https://doi.org/10.1002/9781118763520
Couper, M. P., & Ofstedal, M. B. (2009). Keeping in contact with mobile sample members. In P. Lynn (Ed.), Methodology of longitudinal surveys (pp. 183–203). Wiley. https://doi.org/10.1002/9780470743874.ch11
Duncan, G. J., & Kalton, G. (1987). Issues of design and analysis of surveys across time. International Statistical Review, 55(1), 97–117. https://doi.org/10.2307/1403273
Fitzgerald, J., Gottschalk, P., & Moffitt, R. (1998). An analysis of sample attrition in panel data: The Michigan Panel Study of Income Dynamics. The Journal of Human Resources, 33(2), 251–299. https://doi.org/10.2307/146433
Halpern-Manners, A., Warren, J. R., & Torche, F. (2017). Panel conditioning in the General Social Survey. Sociological Methods & Research, 46(1), 103–124. https://doi.org/10.1177/0049124114532445
Jäckle, A. (2009). Dependent interviewing: A framework and application to current research. In P. Lynn (Ed.), Methodology of longitudinal surveys (pp. 93–111). Wiley. https://doi.org/10.1002/9780470743874.ch6
Kalton, G., & Citro, C. F. (1993). Panel surveys: Adding the fourth dimension. Survey Methodology, 19(2), 205–215.
Kalton, G., Kasprzyk, D., & McMillen, D. B. (1989). Nonsampling errors in panel surveys. In D. Kasprzyk, G. Duncan, G. Kalton, & M. P. Singh (Eds.), Panel surveys (pp. 249–270). Wiley.
Kasprzyk, D., Duncan, G. J., Kalton, G., & Singh, M. P. (Eds.). (1989). Panel surveys. Wiley.
Laurie, H., Smith, R., & Scott, L. (1999). Strategies for reducing nonresponse in a longitudinal panel survey. Journal of Official Statistics, 15(2), 269–282.
Lugtig, P. (2014). Panel attrition: Separating stayers, fast attriters, gradual attriters, and lurkers. Sociological Methods & Research, 43(4), 699–723. https://doi.org/10.1177/0049124113520305
Lynn, P. (2013). Alternative sequential mixed-mode designs: Effects on attrition rates, attrition bias, and costs. Journal of Survey Statistics and Methodology, 1(2), 183–205. https://doi.org/10.1093/jssam/smt015
Lynn, P. (Ed.). (2009). Methodology of longitudinal surveys. Wiley. https://doi.org/10.1002/9780470743874
Lynn, P., Jäckle, A., Jenkins, S. P., & Sala, E. (2006). The effects of dependent interviewing on responses to questions on income sources. Journal of Official Statistics, 22(3), 357–384.
Scherpenzeel, A. C., & Das, M. (2010). "True" longitudinal and probability-based internet panels: Evidence from the Netherlands. In M. Das, P. Ester, & L. Kaczmirek (Eds.), Social and behavioral research and the internet: Advances in applied methods and research strategies (pp. 77–104). Routledge.
Singer, J. D., & Willett, J. B. (2003). Applied longitudinal data analysis: Modeling change and event occurrence. Oxford University Press. https://doi.org/10.1093/acprof:oso/9780195152968.001.0001
Sturgis, P., Allum, N., & Brunton-Smith, I. (2009). Attitudes over time: The psychology of panel conditioning. In P. Lynn (Ed.), Methodology of longitudinal surveys (pp. 113–126). Wiley. https://doi.org/10.1002/9780470743874.ch7
Uhrig, S. C. N. (2008). The nature and causes of attrition in the British Household Panel Survey (ISER Working Paper No. 2008-05). Institute for Social and Economic Research, University of Essex.
Warren, J. R., & Halpern-Manners, A. (2012). Panel conditioning in longitudinal social science surveys. Sociological Methods & Research, 41(4), 491–534. https://doi.org/10.1177/0049124112460374
Watson, N., & Wooden, M. (2009). Identifying factors affecting longitudinal survey response. In P. Lynn (Ed.), Methodology of longitudinal surveys (pp. 157–181). Wiley. https://doi.org/10.1002/9780470743874.ch10