
Surveys · Nonresponse, weighting and data quality
Mode Effects: Why the Same Question Gives Different Answers by Channel
The same survey question can produce different answers when asked face to face, by telephone, online or on paper. This article explains why mode effects occur, which kinds of questions they affect most and how researchers can design and analyse surveys to reduce them.
Surveys collect data through several channels, or modes: face-to-face interviews, telephone interviews, web questionnaires, paper questionnaires and, increasingly, combinations of these. A question that is worded identically in every mode can still produce different answers depending on how it is asked. These differences are called mode effects (de Leeuw, 2005; Jäckle et al., 2010).
Mode effects matter whenever results from different modes are compared or combined. A tracking survey that moves from telephone to web may show an apparent change in opinion that is really a change in method. A mixed-mode survey that lets respondents choose how to answer may combine answers that are not directly comparable. Understanding why mode effects occur helps researchers anticipate them, reduce them and interpret results correctly.
Two kinds of mode difference
Differences between modes have two sources. Selection effects arise because different people respond in different modes: younger people may be more likely to answer online and older people by telephone or on paper. Measurement effects arise because the same person would give a different answer in a different mode. Only measurement effects are mode effects in the strict sense, but in practice the two are entangled, and separating them is one of the main challenges of mixed-mode research (Vannieuwenhuyze et al., 2010; Hox et al., 2017).
Why measurement differs between modes
Modes differ in several features that influence how respondents understand and answer questions (de Leeuw, 2005; Tourangeau et al., 2000). Figure 1 summarises four of the most important.
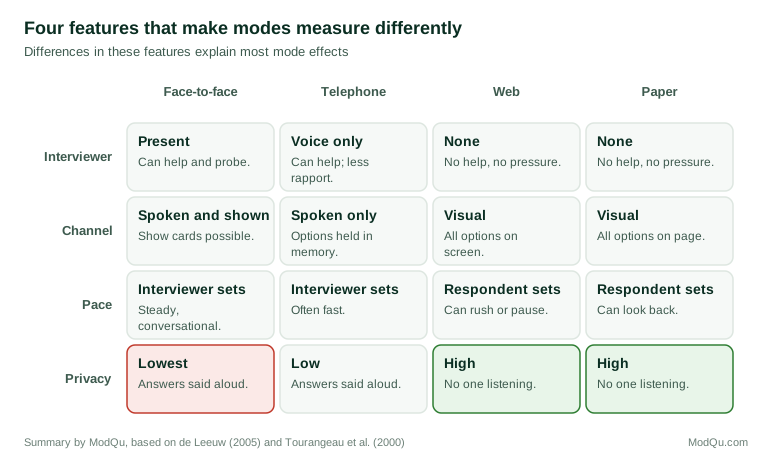
Interviewer presence. In face-to-face and telephone interviews, the respondent answers to another person. This can help, because the interviewer can clarify questions, encourage effort and probe incomplete answers. It can also hurt, because respondents may shape their answers to make a good impression, a tendency called social desirability bias (Tourangeau & Yan, 2007).
Channel of communication. Telephone interviews are purely aural: respondents must hold the question and response options in memory. Web and paper questionnaires are visual: respondents can see all options at once and reread them. Face-to-face interviews can use both, for example by handing respondents a card that lists the options. Aural and visual presentation lead to different response order effects: options heard last are more likely to be chosen in aural modes, while options seen first are more likely to be chosen in visual modes (Krosnick & Alwin, 1987; Schwarz et al., 1991).
Control of pace. Interviewers set the pace in interviewer-administered modes, and telephone interviews in particular often move quickly. In self-administered modes, respondents set their own pace, which allows careful thought but also allows rushing.
Privacy. Self-administered modes offer more privacy because no one hears the answers. Paper and web questionnaires generally produce more reports of sensitive or undesirable behaviour than interviews (Tourangeau & Smith, 1996; Richman et al., 1999).
Which questions are most affected
Mode effects are not uniform. Some kinds of question are much more sensitive to mode than others.
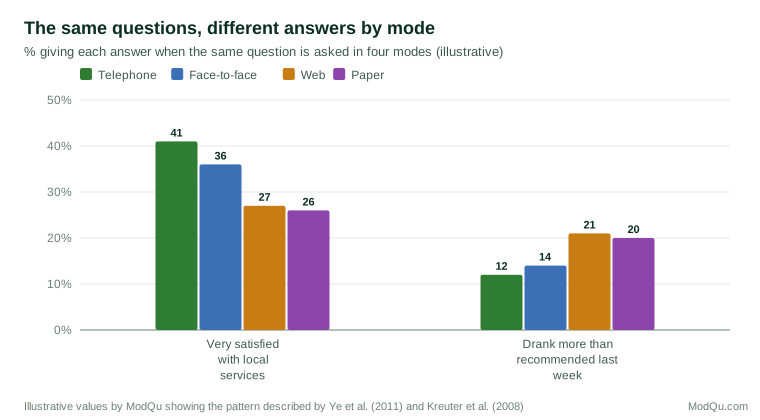
Sensitive questions. Questions about drug use, sexual behaviour, alcohol consumption, income and illegal acts show some of the largest differences. Kreuter et al. (2008) compared telephone interviews, interactive voice response and web surveys of university graduates and found that the web produced the most reports of undesirable facts, such as failing a class, and the fewest reports of desirable ones, and that records confirmed the web answers were more accurate.
Opinion and rating questions. Interviewer-administered modes, especially telephone, tend to produce more positive answers and more use of the extreme positive end of rating scales. Ye et al. (2011) conducted a meta-analysis and found that telephone respondents gave more extremely positive answers than respondents in other modes, a pattern they attributed partly to the desire to appear agreeable to the interviewer. Christian et al. (2009) found that the visual design of rating scales in web surveys also affected answers, so differences between telephone and web can reflect both mode and layout.
Questions prone to satisficing. Holbrook et al. (2003) found more non-differentiation, acquiescence and "no opinion" answers in telephone interviews than in face-to-face interviews with the same long questionnaire. Chang and Krosnick (2009) found less satisficing in probability-based internet surveys than in telephone surveys. Heerwegh and Loosveldt (2008), on the other hand, found more "don't know" answers and less differentiation in a web survey than in face-to-face interviews, showing that the direction of effects depends on the particular modes and designs compared.
Simple factual questions. Questions about age, household size or employment status usually show small mode effects, because the answer is clear and not sensitive.
Figure 2 illustrates the contrasting direction of effects for a rating question and a sensitive question.
Devices within the web mode
The web is not a single mode. Respondents answer web surveys on desktop computers, laptops, tablets and smartphones, and these devices differ in screen size, input method and the settings in which they are used. A grid of questions that fits comfortably on a computer screen may require scrolling and zooming on a phone, and long open answers are harder to type on a small keyboard. Studies comparing devices have generally found modest differences in data quality when questionnaires are designed for mobile use, but larger differences when they are not (Couper et al., 2017; Tourangeau et al., 2018). Because the share of respondents using smartphones has grown quickly, a web survey run today may differ in its device mix from the same survey run a few years ago, which creates a hidden source of change in long-running series. Recording the device used and designing questions that display well on small screens reduce this risk. Analysts can then check whether results differ by device after accounting for the different people who use each one.
Weighing mode effects against other errors
Mode choice is not only about measurement. Each mode also has its own coverage, response rate and cost. Telephone surveys can reach people quickly but now achieve low response. Face-to-face interviews achieve higher response and allow complex questionnaires but are expensive. Web surveys are cheap and private but exclude people without internet access unless other modes are offered. Mixing modes is often the best way to reduce coverage and nonresponse error, even though it introduces measurement differences (de Leeuw, 2005). Groves (1989) argued that survey design should consider all sources of error together, balancing them against cost. From this perspective, the goal is not to eliminate mode effects at any price but to understand their likely size and direction and to choose the design with the smallest total error for the budget.
Mode effects in market and customer research
Customer satisfaction and brand surveys are especially exposed to mode effects, because they rely on rating scales, which show some of the largest differences between interviewer-administered and self-administered modes (Ye et al., 2011). A company that moves its customer survey from telephone calls to email invitations may see satisfaction scores fall, not because customers are less satisfied but because they no longer give an interviewer the polite, positive answer. Comparisons between business units or countries that use different modes are similarly risky. Using the same mode across units, or running a calibration study before changing mode, avoids misleading conclusions.
Designing to reduce mode effects
When a survey uses more than one mode, or when a long-running survey changes mode, several design strategies reduce measurement differences (Dillman et al., 2014; de Leeuw, 2005).
Unified mode design. Also called unimode design, this approach writes questions so that they work the same way in every mode. Response options are kept short enough to be read aloud, the same number of options is used everywhere and visual features that cannot be reproduced aurally are avoided. Dillman et al. (2014) recommended this approach for mixed-mode surveys.
Mode-specific optimisation. An alternative approach accepts that each mode has strengths and designs each version to measure the concept as well as possible, even if the questions differ. This can give better measurement within each mode but makes comparison harder.
Self-administration for sensitive items. In interviewer-administered surveys, sensitive questions can be moved to a self-administered section, for example on a tablet handed to the respondent, to reduce social desirability effects.
Avoiding formats that magnify differences. Agree–disagree items and long lists of options are especially prone to mode effects. Item-specific questions and shorter lists travel better between modes.
Estimating and adjusting for mode effects
When mode effects cannot be prevented, they can sometimes be estimated and adjusted for. The most direct method is an experiment in which respondents are randomly assigned to modes, so that differences reflect measurement rather than selection (Jäckle et al., 2010). In mixed-mode surveys where respondents choose their mode, statistical methods can attempt to separate selection and measurement effects, for example by using a reference sample interviewed in a single mode or by modelling the choice of mode with background variables (Vannieuwenhuyze et al., 2010; Klausch et al., 2013). These methods depend on assumptions that cannot be fully tested, so results should be interpreted with care.
For long-running surveys, the safest approach when changing mode is to run old and new modes in parallel for a period. The difference between them can then be used to bridge the series, so that a change in method is not mistaken for a change in the population (Olson et al., 2021).
An example
A city has surveyed residents by telephone every year for a decade. Satisfaction with city services has been stable at around 40 per cent "very satisfied". To reduce costs, the city plans to move to a push-to-web design, inviting residents by mail to answer online with a paper option. In the first year, it runs both designs with random halves of the sample. The web and paper version shows 28 per cent "very satisfied", but also shows higher reports of problems such as noise and safety concerns. The city publishes both results, explains the difference and uses the parallel year to adjust its trend line, so that the apparent fall in satisfaction is not reported as a real decline (illustrative example).
Conclusion
Mode effects arise because survey modes differ in interviewer presence, channel of communication, control of pace and privacy. These differences affect sensitive questions, opinion ratings and questions prone to satisficing most strongly. Unified question design, self-administration for sensitive items, careful choice of formats and experiments or parallel runs when modes change all help to keep mode effects from being mistaken for real differences. As surveys increasingly combine several modes, understanding these effects is essential for producing consistent and comparable knowledge.
References
Chang, L., & Krosnick, J. A. (2009). National surveys via RDD telephone interviewing versus the internet: Comparing sample representativeness and response quality. Public Opinion Quarterly, 73(4), 641–678. https://doi.org/10.1093/poq/nfp075
Christian, L. M., Parsons, N. L., & Dillman, D. A. (2009). Designing scalar questions for web surveys. Sociological Methods & Research, 37(3), 393–425. https://doi.org/10.1177/0049124108330004
Couper, M. P., Antoun, C., & Mavletova, A. (2017). Mobile web surveys: A total survey error perspective. In P. P. Biemer, E. de Leeuw, S. Eckman, B. Edwards, F. Kreuter, L. E. Lyberg, N. C. Tucker, & B. T. West (Eds.), Total survey error in practice (pp. 133–154). Wiley.
de Leeuw, E. D. (2005). To mix or not to mix data collection modes in surveys. Journal of Official Statistics, 21(2), 233–255.
Dillman, D. A., Smyth, J. D., & Christian, L. M. (2014). Internet, phone, mail, and mixed-mode surveys: The tailored design method (4th ed.). Wiley.
Groves, R. M. (1989). Survey errors and survey costs. Wiley. https://doi.org/10.1002/0471725277
Heerwegh, D., & Loosveldt, G. (2008). Face-to-face versus web surveying in a high-internet-coverage population: Differences in response quality. Public Opinion Quarterly, 72(5), 836–846. https://doi.org/10.1093/poq/nfn045
Holbrook, A. L., Green, M. C., & Krosnick, J. A. (2003). Telephone versus face-to-face interviewing of national probability samples with long questionnaires: Comparisons of respondent satisficing and social desirability response bias. Public Opinion Quarterly, 67(1), 79–125. https://doi.org/10.1086/346010
Hox, J., de Leeuw, E., & Klausch, T. (2017). Mixed-mode research: Issues in design and analysis. In P. P. Biemer, E. de Leeuw, S. Eckman, B. Edwards, F. Kreuter, L. E. Lyberg, N. C. Tucker, & B. T. West (Eds.), Total survey error in practice (pp. 511–530). Wiley. https://doi.org/10.1002/9781119041702.ch23
Jäckle, A., Roberts, C., & Lynn, P. (2010). Assessing the effect of data collection mode on measurement. International Statistical Review, 78(1), 3–20. https://doi.org/10.1111/j.1751-5823.2010.00102.x
Klausch, T., Hox, J. J., & Schouten, B. (2013). Measurement effects of survey mode on the equivalence of attitudinal rating scale questions. Sociological Methods & Research, 42(3), 227–263. https://doi.org/10.1177/0049124113500480
Kreuter, F., Presser, S., & Tourangeau, R. (2008). Social desirability bias in CATI, IVR, and web surveys: The effects of mode and question sensitivity. Public Opinion Quarterly, 72(5), 847–865. https://doi.org/10.1093/poq/nfn063
Krosnick, J. A., & Alwin, D. F. (1987). An evaluation of a cognitive theory of response-order effects in survey measurement. Public Opinion Quarterly, 51(2), 201–219. https://doi.org/10.1086/269029
Olson, K., Smyth, J. D., Horwitz, R., Keeter, S., Lesser, V., Marken, S., Mathiowetz, N. A., McCarthy, J. S., O'Brien, E., Opsomer, J. D., Steiger, D., Sterrett, D., Su, J., Suzer-Gurtekin, Z. T., Turakhia, C., & Wagner, J. (2021). Transitions from telephone surveys to self-administered and mixed-mode surveys: AAPOR task force report. Journal of Survey Statistics and Methodology, 9(3), 381–411. https://doi.org/10.1093/jssam/smz062
Richman, W. L., Kiesler, S., Weisband, S., & Drasgow, F. (1999). A meta-analytic study of social desirability distortion in computer-administered questionnaires, traditional questionnaires, and interviews. Journal of Applied Psychology, 84(5), 754–775. https://doi.org/10.1037/0021-9010.84.5.754
Schwarz, N., Strack, F., Hippler, H.-J., & Bishop, G. (1991). The impact of administration mode on response effects in survey measurement. Applied Cognitive Psychology, 5(3), 193–212. https://doi.org/10.1002/acp.2350050304
Tourangeau, R., & Smith, T. W. (1996). Asking sensitive questions: The impact of data collection mode, question format, and question context. Public Opinion Quarterly, 60(2), 275–304. https://doi.org/10.1086/297751
Tourangeau, R., & Yan, T. (2007). Sensitive questions in surveys. Psychological Bulletin, 133(5), 859–883. https://doi.org/10.1037/0033-2909.133.5.859
Tourangeau, R., Rips, L. J., & Rasinski, K. (2000). The psychology of survey response. Cambridge University Press. https://doi.org/10.1017/CBO9780511819322
Tourangeau, R., Sun, H., Yan, T., Maitland, A., Rivero, G., & Williams, D. (2018). Web surveys by smartphones and tablets: Effects on data quality. Social Science Computer Review, 36(5), 542–556. https://doi.org/10.1177/0894439317719438
Vannieuwenhuyze, J., Loosveldt, G., & Molenberghs, G. (2010). A method for evaluating mode effects in mixed-mode surveys. Public Opinion Quarterly, 74(5), 1027–1045. https://doi.org/10.1093/poq/nfq059
Ye, C., Fulton, J., & Tourangeau, R. (2011). More positive or more extreme? A meta-analysis of mode differences in response choice. Public Opinion Quarterly, 75(2), 349–365. https://doi.org/10.1093/poq/nfr009