
Surveys · Types and applications
Knowledge Surveys as Diagnostic Tools for Assessing Learning and Conceptual Understanding
Knowledge surveys and concept inventories use survey methods to measure what learners know and how well they understand key ideas. This article explains how they are built, how they differ from tests, what confidence ratings can and cannot show, and how teachers and trainers use the results.
Surveys usually measure opinions, behaviour or characteristics. They can also measure knowledge. In education and training, two kinds of instrument use survey methods to find out what learners know and understand: knowledge surveys, which ask learners how confident they are that they could answer questions about a course's content, and concept inventories, which test understanding of key ideas with carefully designed multiple-choice questions. Both are used as diagnostic tools, to find out where learners stand before and after teaching, rather than to award grades.
Knowledge surveys
A knowledge survey lists the questions a course will address, often dozens or even hundreds of them, covering everything from basic facts to complex problems. Learners do not answer the questions. Instead, for each one they rate their confidence that they could answer it, typically on a three-point scale: "I could answer this now", "I could answer at least half of this or know where to find the answer quickly" and "I could not answer this" (Nuhfer & Knipp, 2003).
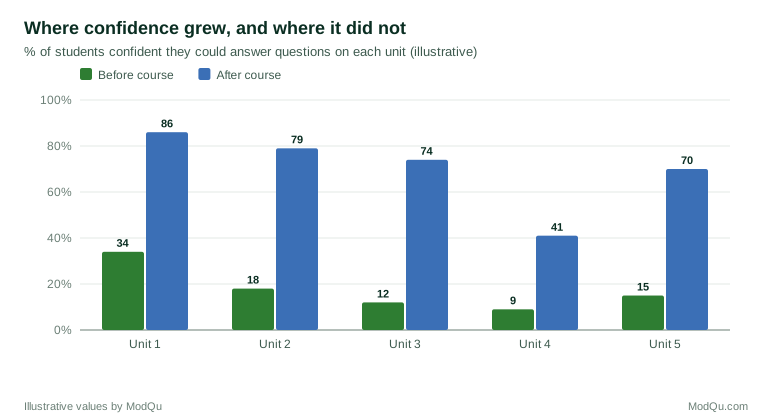
The survey is usually given at the start of a course and again at the end. Because it covers the whole course, it shows teachers which topics learners already feel confident about and which are new, and it shows learners what the course expects of them. Comparing the two administrations shows where confidence grew and where it did not, as Figure 1 illustrates.
Confidence is not knowledge
The obvious question is whether confidence reflects real knowledge. The evidence is mixed. People's assessments of their own knowledge are often inaccurate, and those with the least knowledge tend to overestimate it most (Kruger & Dunning, 1999; Dunning et al., 2004). A meta-analysis found that self-assessments of knowledge were only moderately related to tested knowledge and were more closely related to learners' satisfaction and motivation (Sitzmann et al., 2010). Studies comparing knowledge surveys with test scores in particular courses have found relationships ranging from weak to fairly strong, with overconfidence common among weaker students (Bell & Volckmann, 2011; Favazzo et al., 2014). Nuhfer et al. (2016) argued that some apparent patterns in self-assessment data partly reflect random noise and how the data are graphed, and that aggregated self-assessments can be more accurate than individual ones suggest.
The practical conclusion is that knowledge surveys are best used to compare topics and groups, and to prompt learners to reflect, rather than to judge what any individual knows.
Concept inventories
A concept inventory measures understanding directly. Its questions target the core ideas of a subject, and the wrong answers are built from misconceptions that research has shown learners commonly hold. A learner who chooses a particular wrong answer reveals not just that they are wrong but how they are thinking.
The best-known example is the Force Concept Inventory, which tests understanding of basic ideas about force and motion in physics (Hestenes et al., 1992). Many students who could solve standard textbook problems performed poorly on it, showing that they had learned procedures without understanding the concepts. Adams and Wieman (2011) described how such instruments are developed: by interviewing learners to find out how they think, writing questions in their language, testing them in think-aloud interviews and checking their statistical properties.
Measuring learning gains
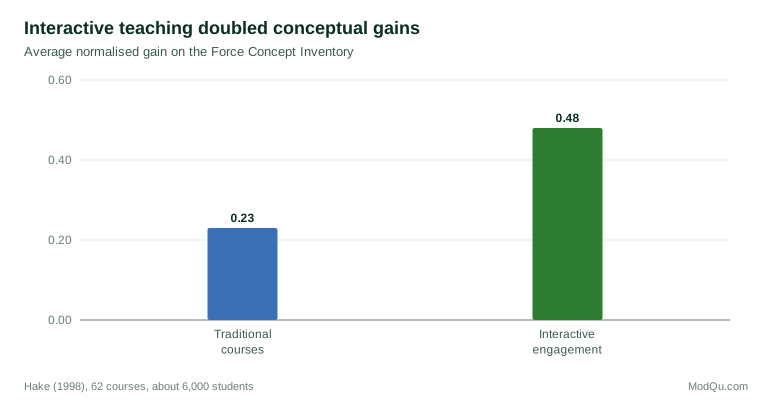
Concept inventories are usually given before and after teaching. Because learners start at different levels, results are often expressed as a normalised gain: the improvement achieved as a share of the improvement possible. Hake (1998) collected Force Concept Inventory results from about 6,000 students and found that courses using interactive engagement methods achieved average normalised gains about twice those of traditional lecture courses, as shown in Figure 2. A later meta-analysis across science, engineering and mathematics confirmed that active learning improves performance (Freeman et al., 2014).
Combining confidence and correctness
Some instruments combine the two approaches by asking learners to answer each question and then rate their confidence in the answer. This produces four groups for each question: correct and confident, correct but unsure, wrong but unsure, and wrong but confident. The last group is the most important for teaching, because it identifies misconceptions that learners hold firmly and are unlikely to correct on their own. Questions with many confident wrong answers point to ideas that need to be confronted directly in teaching rather than simply repeated. Tracking these groups before and after teaching shows whether misconceptions have been replaced or merely joined by uncertainty.
An example
A university chemistry department gives a 120-item knowledge survey and a short concept inventory to first-year students at the start and end of a course. The knowledge survey shows that confidence rose strongly in most units but only slightly in the unit on chemical equilibrium. The concept inventory confirms the problem: the share of students choosing the answer based on a common misconception about equilibrium barely changes. Many of those students were confident in their wrong answers. The department redesigns the equilibrium unit around group problem-solving, and the following year the misconception falls by half (illustrative example).
Designing diagnostic surveys
- Cover the full range of content and difficulty, from recall to application.
- Write questions in learners' language, tested through interviews.
- Use the same instrument before and after, so that change can be measured.
- Keep it ungraded, so that learners answer honestly rather than strategically.
- Report results by topic, to show where teaching should change.
Uses beyond the classroom
Organisations use knowledge surveys and short concept tests to plan training, to check whether training worked and to identify gaps in staff understanding of procedures such as safety rules. The same principles apply: diagnose before teaching, measure again afterwards and use the results to improve the teaching rather than to rank individuals. Such diagnosis is a form of formative assessment, which research has shown can substantially improve learning (Black & Wiliam, 1998).
Conclusion
Knowledge surveys and concept inventories bring survey methods into education. Knowledge surveys map learners' confidence across a whole course, and concept inventories reveal how learners think about core ideas. Confidence ratings must be interpreted with care, because they are only partly related to actual knowledge. Used together and before and after teaching, these tools give teachers and trainers a clear diagnosis of what has been learned and what has not.
References
Adams, W. K., & Wieman, C. E. (2011). Development and validation of instruments to measure learning of expert-like thinking. International Journal of Science Education, 33(9), 1289–1312. https://doi.org/10.1080/09500693.2010.512369
Bell, P., & Volckmann, D. (2011). Knowledge surveys in general chemistry: Confidence, overconfidence, and performance. Journal of Chemical Education, 88(11), 1469–1476. https://doi.org/10.1021/ed100328c
Black, P., & Wiliam, D. (1998). Assessment and classroom learning. Assessment in Education: Principles, Policy & Practice, 5(1), 7–74. https://doi.org/10.1080/0969595980050102
Dunning, D., Heath, C., & Suls, J. M. (2004). Flawed self-assessment: Implications for health, education, and the workplace. Psychological Science in the Public Interest, 5(3), 69–106. https://doi.org/10.1111/j.1529-1006.2004.00018.x
Favazzo, L., Willford, J. D., & Watson, R. M. (2014). Correlating student knowledge and confidence using a graded knowledge survey to assess student learning in a general microbiology classroom. Journal of Microbiology & Biology Education, 15(2), 251–258. https://doi.org/10.1128/jmbe.v15i2.693
Freeman, S., Eddy, S. L., McDonough, M., Smith, M. K., Okoroafor, N., Jordt, H., & Wenderoth, M. P. (2014). Active learning increases student performance in science, engineering, and mathematics. Proceedings of the National Academy of Sciences, 111(23), 8410–8415. https://doi.org/10.1073/pnas.1319030111
Hake, R. R. (1998). Interactive-engagement versus traditional methods: A six-thousand-student survey of mechanics test data for introductory physics courses. American Journal of Physics, 66(1), 64–74. https://doi.org/10.1119/1.18809
Hestenes, D., Wells, M., & Swackhamer, G. (1992). Force concept inventory. The Physics Teacher, 30(3), 141–158. https://doi.org/10.1119/1.2343497
Kruger, J., & Dunning, D. (1999). Unskilled and unaware of it: How difficulties in recognizing one's own incompetence lead to inflated self-assessments. Journal of Personality and Social Psychology, 77(6), 1121–1134. https://doi.org/10.1037/0022-3514.77.6.1121
Nuhfer, E., & Knipp, D. (2003). The knowledge survey: A tool for all reasons. To Improve the Academy, 21(1), 59–78. https://doi.org/10.1002/j.2334-4822.2003.tb00381.x
Nuhfer, E., Cogan, C., Fleischer, S., Gaze, E., & Wirth, K. (2016). Random number simulations reveal how random noise affects the measurements and graphical portrayals of self-assessed competency. Numeracy, 9(1), Article 4. https://doi.org/10.5038/1936-4660.9.1.4
Sitzmann, T., Ely, K., Brown, K. G., & Bauer, K. N. (2010). Self-assessment of knowledge: A cognitive learning or affective measure? Academy of Management Learning & Education, 9(2), 169–191. https://doi.org/10.5465/amle.9.2.zqr169