
Surveys · Types and applications
Cross-Lagged Panel Models Applied to Survey Data for Temporal Knowledge Inference
Cross-lagged panel models use repeated survey measurements to ask whether one variable predicts later change in another. This article explains how the models work, why the classic version can mislead, and how the random intercept version separates stable differences between people from change within them.
Panel surveys measure the same people at several points in time. A common question is which of two related things comes first. Does job satisfaction lead to better health, or does good health lead to greater job satisfaction? Does trust in institutions encourage voting, or does voting build trust? Cross-lagged panel models are a widely used way of analysing such questions with survey data.
The classic model
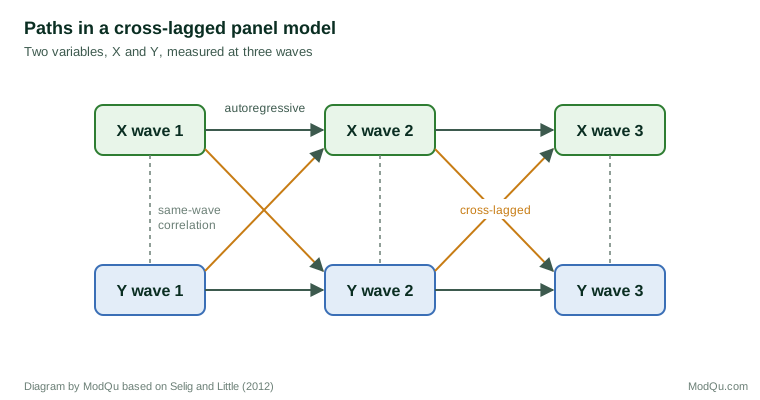
The cross-lagged panel model (CLPM) uses two variables, X and Y, measured at two or more waves. It estimates three kinds of relationship, shown in Figure 1 (Finkel, 1995; Selig & Little, 2012):
- Autoregressive paths link each variable to itself at the next wave, capturing stability.
- Cross-lagged paths link X at one wave to Y at the next, and Y to X, after controlling for the earlier value of the outcome.
- Within-wave correlations capture the association between X and Y measured at the same time.
If the path from X to later Y is larger than the path from Y to later X, researchers often conclude that X is more likely to influence Y than the reverse. The idea goes back to early work on cross-lagged correlations, which was soon criticised as a test of causal direction (Kenny, 1975; Rogosa, 1980).
The problem of stable differences
The classic model has a serious weakness. It treats all differences between people as if they could change from wave to wave. In reality, much of the variation in many survey measures reflects stable differences between people: some people are always more satisfied, healthier or more trusting than others. Hamaker et al. (2015) showed that when such stable differences exist, the cross-lagged paths in the classic model mix two things: relationships between people's stable levels, and relationships between their changes over time. The result can be cross-lagged effects that appear when none exist within individuals, or effects in the wrong direction.
The random intercept model
The random intercept cross-lagged panel model (RI-CLPM) adds a stable, person-specific level for each variable (Hamaker et al., 2015). The cross-lagged paths then describe how a person's deviation from their own usual level on X predicts their later deviation from their own usual level on Y. This is a within-person question: when someone is more satisfied than usual, are they later healthier than usual? Extensions handle more variables, multiple groups and measurement error (Mulder & Hamaker, 2021).
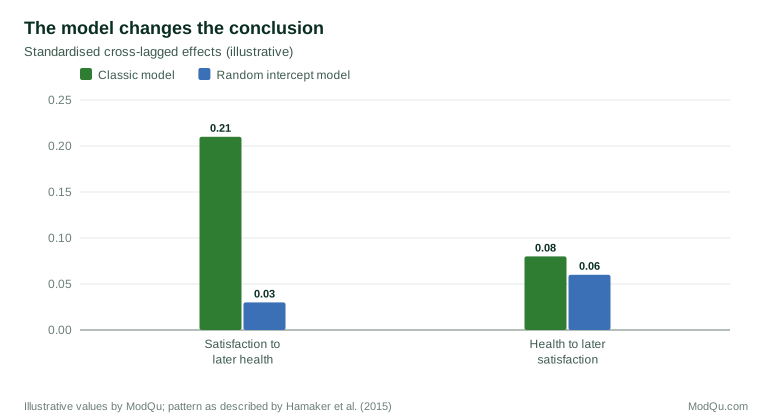
Results from the two models often differ substantially, as Figure 2 illustrates. Orth et al. (2021) compared seven competing models in several data sets and found that conclusions about prospective effects depended on the model chosen. Lucas (2023) argued that the classic model is almost never appropriate and that researchers should use models that separate stable and changing components.
Issues specific to survey data
Survey data add their own complications. Answers contain measurement error, which weakens the autoregressive paths and can create spurious cross-lagged effects; using several questions for each concept and modelling them as latent variables reduces this problem. Panel attrition means that later waves may contain a different mix of people from earlier ones, so missing data should be handled with full-information methods or multiple imputation rather than by dropping incomplete cases. Changes in question wording or survey mode between waves can look like real change and should be avoided or tested. Finally, the waves of most surveys are a year or more apart, which may be too long to capture effects that occur within weeks.
An example
A researcher uses five annual waves of a household panel to study whether job satisfaction affects self-rated health. The classic model shows a clear path from satisfaction to later health and a weaker path in the other direction, suggesting that satisfaction improves health. The random intercept model shows that most of this association reflects stable differences: people who are generally more satisfied also tend to be generally healthier. Within individuals, a year of unusually high satisfaction predicts little change in health the following year. The researcher reports both results and concludes that the evidence for a within-person effect is weak (illustrative example).
Practical guidance
- Use at least three waves, and preferably more, so that stable and changing components can be separated.
- Match the interval between waves to the time over which effects are expected to occur.
- Prefer within-person models such as the RI-CLPM, or fixed effects approaches (Allison et al., 2017), when the question is about change within people (Usami et al., 2019).
- Treat results as evidence about timing, not proof of causation, since unmeasured variables that change over time can still create spurious paths.
Conclusion
Cross-lagged panel models make use of the time ordering in panel surveys, but the classic version can confuse differences between people with change within them. Adding random intercepts, using enough waves and interpreting results cautiously allow survey data to support more credible conclusions about which changes come first.
References
Allison, P. D., Williams, R., & Moral-Benito, E. (2017). Maximum likelihood for cross-lagged panel models with fixed effects. Socius, 3. https://doi.org/10.1177/2378023117710578
Finkel, S. E. (1995). Causal analysis with panel data. SAGE. https://doi.org/10.4135/9781412983594
Hamaker, E. L., Kuiper, R. M., & Grasman, R. P. P. P. (2015). A critique of the cross-lagged panel model. Psychological Methods, 20(1), 102–116. https://doi.org/10.1037/a0038889
Kenny, D. A. (1975). Cross-lagged panel correlation: A test for spuriousness. Psychological Bulletin, 82(6), 887–903. https://doi.org/10.1037/0033-2909.82.6.887
Lucas, R. E. (2023). Why the cross-lagged panel model is almost never the right choice. Advances in Methods and Practices in Psychological Science, 6(1). https://doi.org/10.1177/25152459231158378
Mulder, J. D., & Hamaker, E. L. (2021). Three extensions of the random intercept cross-lagged panel model. Structural Equation Modeling, 28(4), 638–648. https://doi.org/10.1080/10705511.2020.1784738
Orth, U., Clark, D. A., Donnellan, M. B., & Robins, R. W. (2021). Testing prospective effects in longitudinal research: Comparing seven competing cross-lagged models. Journal of Personality and Social Psychology, 120(4), 1013–1034. https://doi.org/10.1037/pspp0000358
Rogosa, D. (1980). A critique of cross-lagged correlation. Psychological Bulletin, 88(2), 245–258. https://doi.org/10.1037/0033-2909.88.2.245
Selig, J. P., & Little, T. D. (2012). Autoregressive and cross-lagged panel analysis for longitudinal data. In B. Laursen, T. D. Little, & N. A. Card (Eds.), Handbook of developmental research methods (pp. 265–278). Guilford Press.
Usami, S., Murayama, K., & Hamaker, E. L. (2019). A unified framework of longitudinal models to examine reciprocal relations. Psychological Methods, 24(5), 637–657. https://doi.org/10.1037/met0000210