
Surveys · Types and applications
Household Surveys in Official Statistics
Household surveys run by national statistical offices produce many of the most important figures in public life, from the unemployment rate to measures of poverty. This article explains how these surveys are designed, how estimates are produced, how quality is assured and the challenges they now face.
The monthly unemployment rate, the share of children living in poverty, the average amount households spend on food and the number of people who were victims of crime last year are all familiar figures. Most of them come from household surveys run by national statistical offices. These surveys interview a sample of households, usually tens of thousands each year, and use the answers to estimate the characteristics of the whole population. They are among the largest and most carefully designed surveys in the world, and their results guide decisions on interest rates, welfare spending, taxation and public services (United Nations, 2005).
A brief history
Before the 1930s, official statistics about the population came mainly from censuses and from administrative records, such as registers of births and deaths or counts of people receiving relief. Censuses were complete but infrequent, and administrative records covered only people who came into contact with government. The economic depression of the 1930s created an urgent need for timely figures on unemployment, which neither source could provide.
The answer was the sample survey. Statisticians showed that a properly selected random sample of a few thousand households could estimate national figures with known precision, at a fraction of the cost of a census. In the United States, work on sampling at the Census Bureau and elsewhere led to a monthly survey of the labour force in the early 1940s, which became the Current Population Survey. The theory of sampling from finite populations developed in the same period gave these surveys a firm statistical basis (Hansen et al., 1953). After the Second World War, national statistical offices around the world adopted household surveys, and international organisations helped developing countries to establish their own (United Nations, 2005).
What household surveys measure
Household surveys in official statistics fall into several families, each designed for a particular purpose.
- Labour force surveys measure employment, unemployment, hours worked and related topics, following definitions agreed internationally. In the United States, the Current Population Survey has produced the official unemployment rate since the 1940s, and its design was a landmark in the development of probability sampling (Hansen et al., 1955).
- Income and living conditions surveys measure household income, poverty, material deprivation and inequality.
- Household expenditure surveys record what households buy, often through diaries kept for one or two weeks. Their results provide the weights for consumer price indices.
- Time use surveys ask people to record their activities through a day, showing how time is divided between paid work, unpaid work, care and leisure (Juster et al., 2003).
- Crime victimisation surveys measure crimes that people have experienced, including the many that are never reported to the police.
- Health surveys measure health, behaviours and use of care.
- Continuous multi-topic surveys, such as the American Community Survey, collect a wide range of information every month and replace or supplement the detailed questions once asked in the census (Citro & Kalton, 2007).
In lower-income countries, multi-topic household surveys such as the World Bank's Living Standards Measurement Study collect information on income, consumption, health, education and agriculture from the same households, allowing poverty and its causes to be studied together (Grosh & Glewwe, 2000; Deaton, 1997).
Concepts and questionnaires
The figures produced by household surveys are only as useful as the concepts behind them. Unemployment, for example, is defined internationally as being without work, available to start work and actively looking for work. A labour force survey therefore does not simply ask whether a person is unemployed. It asks a sequence of questions about whether they did any paid work in a reference week, even for one hour, whether they have a job they were temporarily away from, whether they looked for work in recent weeks and whether they could start within two weeks. The classification is derived from the answers. Small changes in these questions can change the measured rate, which is why statistical offices change questionnaires rarely and test changes carefully before introducing them.
International standards make figures comparable between countries. Definitions of employment and unemployment are agreed through the International Labour Organization, and many countries use common questionnaires or common output variables for income, living conditions and time use. Harmonisation of this kind allows international organisations to compare poverty, unemployment and inequality across countries, but it requires each country to adapt its survey to the common standard while keeping its own national series consistent.
How the samples are designed
The sampling frame
Every probability sample needs a sampling frame, a list from which units are selected. For household surveys, the frame is usually a list of addresses or dwellings, taken from a postal address file, a population register, or census enumeration areas updated with recent construction. Countries with population registers, such as the Nordic countries, can sample individuals directly and know their age, sex and other characteristics before contacting them.
Multi-stage area samples
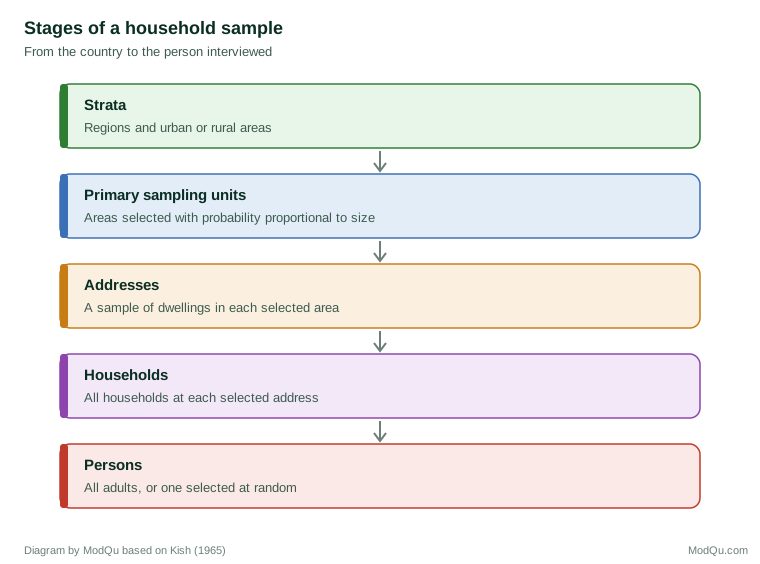
Because interviews have traditionally been conducted in person, household surveys usually use multi-stage cluster samples. The country is divided into areas, and a sample of these primary sampling units is selected, often with probability proportional to their size. Within each selected area, a sample of addresses is chosen, and within each address, the household and sometimes one person in it. Clustering the interviews in a limited number of areas keeps travel costs down. The approach, developed in the 1940s and 1950s, remains the basis of most official household surveys (Hansen et al., 1953; Kish, 1965). Figure 1 shows the stages.
Stratification and clustering
Areas are grouped into strata, such as regions and urban or rural areas, and samples are selected separately in each stratum. Stratification makes estimates more precise and guarantees that every region is represented. Clustering has the opposite effect: because people in the same area tend to be similar, a clustered sample contains less information than a simple random sample of the same size. The ratio of the variance of an estimate from the actual design to that from a simple random sample is the design effect (Kish, 1965). Survey designers balance the cost savings of clustering against its loss of precision.
Rotating panels
Many labour force surveys use a rotating panel design. Each selected address stays in the sample for several periods, for example five consecutive quarters, and a fraction of the sample is replaced each period. Because most of the sample overlaps between one period and the next, estimates of change are more precise than if a completely new sample were drawn each time. Rotation also spreads the burden on households. A known drawback is rotation group bias: estimates differ systematically according to how many times a household has been interviewed, with unemployment often reported more often in the first interview than in later ones (Bailar, 1975).
From answers to estimates
Weighting
Each respondent is given a weight, roughly the number of people in the population that they represent. The starting point is the inverse of the probability of selection. Weights are then adjusted for nonresponse, so that groups with low response rates are not under-represented, and finally calibrated so that weighted totals match independent population estimates by age, sex and region (Deville & Särndal, 1992; Särndal et al., 1992). Calibration ties the survey to the best available population figures and reduces both variance and nonresponse bias.
Variance estimation
Official statistics are published with measures of their precision, such as standard errors or confidence intervals. Because of stratification, clustering and weighting, these cannot be calculated with standard formulas. Statistical offices use methods that reflect the actual design, such as replication methods that recompute estimates on many subsamples.
Small area estimation
National surveys are designed to give precise estimates for the country and its main regions, but users often want figures for smaller areas, such as districts or municipalities, where the sample is too small. Small area estimation combines the survey data with information from administrative sources or the census through statistical models, borrowing strength from areas with similar characteristics. The model of Fay and Herriot (1979), developed to estimate income for small places in the United States, remains widely used (Rao & Molina, 2015).
Quality and trust
Official statistics depend on public trust. National statistical offices follow codes of practice that commit them to professional independence, sound methods, accuracy, timeliness and equal access to results. The European Statistics Code of Practice is one such code (Eurostat, 2017). Fellegi (1996), a former head of Statistics Canada, argued that an effective statistical system depends on relevance, credibility and independence from political influence as much as on technical quality.
Quality is assessed in terms of several dimensions: relevance, accuracy, timeliness, accessibility, coherence and comparability. Accuracy covers all sources of error, not only sampling error, including coverage, nonresponse, measurement and processing errors (Biemer & Lyberg, 2003). Statistical offices publish quality reports that describe these dimensions for their main surveys.
Confidentiality and access
Households take part in official surveys on the understanding that their answers will be kept confidential and used only for statistics. In most countries, this is guaranteed by law, and staff who reveal identifiable information face penalties. Published tables are checked so that no individual or household can be identified, for example by suppressing or adjusting cells based on very few respondents.
Researchers can often use the underlying records, known as microdata, under controlled conditions. Public-use files remove names and addresses and reduce detail on variables such as geography and income that could identify people. More detailed files are available only in secure settings, such as data laboratories where researchers' outputs are checked before release. Access to microdata greatly increases the value of household surveys, because researchers can study questions the statistical office never anticipated.
How the results are used
The results of official household surveys feed directly into decisions. Central banks watch the unemployment rate when setting interest rates. Governments use poverty and income figures to design and evaluate welfare programmes, and in some countries funds are allocated to regions according to survey estimates. Expenditure surveys determine the weights in consumer price indices, which affect pensions, benefits and wage settlements linked to inflation. Researchers use the microdata to study questions from the returns to education to the effects of minimum wages. Because so much depends on them, small changes in methods can have large consequences, and statistical offices explain changes publicly before they take effect.
The challenges
Falling response rates
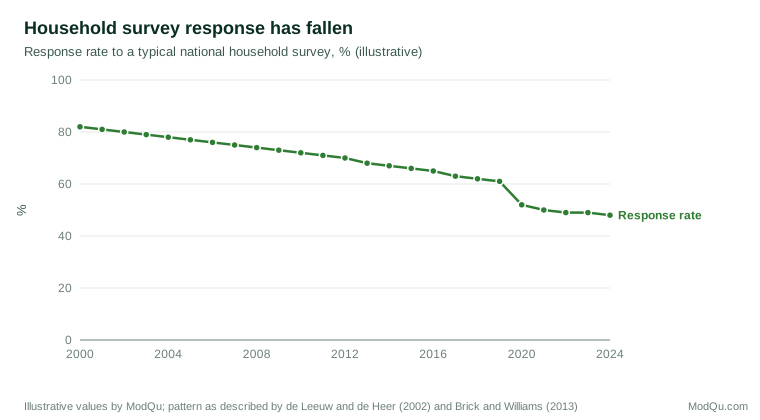
Response rates to household surveys have fallen in most countries over several decades (de Leeuw & de Heer, 2002; Brick & Williams, 2013). Some labour force surveys that once achieved response rates above 80 per cent now achieve 50 per cent or less, and the decline accelerated when face-to-face interviewing was suspended during the COVID-19 pandemic. Figure 2 shows the general pattern. Lower response raises costs, because more effort is needed to obtain each interview, and increases the risk of bias, although bias depends on how different respondents and nonrespondents are rather than on the response rate alone (Groves & Couper, 1998).
Measurement error
Even when households respond, their answers may be inaccurate. Comparisons with administrative records show that household surveys in the United States under-report receipt of government benefits, sometimes substantially, and that under-reporting has grown over time (Meyer et al., 2015). Income from self-employment and investments is also hard to measure. Errors of this kind can bias estimates of poverty and of the effects of policy (Bound et al., 2001).
Cost and timeliness
Face-to-face interviewing is expensive, and the cost per interview has risen as response rates have fallen. Users also want faster and more detailed results than large surveys can easily provide. At the same time, government budgets for statistics are under pressure, so statistical offices must find ways to maintain quality while spending less on each survey. Reducing the length of interviews, moving to cheaper modes and making more use of existing records are the main options, and each brings its own risks to the comparability of long-running series.
The response: new modes and new data
Statistical offices have responded in several ways. Many have added web questionnaires, often as the first mode, with telephone or face-to-face follow-up for those who do not respond online. This reduces costs but introduces mode effects that must be managed so that series remain comparable.
More fundamentally, statistical offices are moving from a model in which each statistic comes from a single survey to one in which estimates combine surveys with administrative data, such as tax, social security and employment records. Citro (2014) described this shift as a move from multiple modes to multiple data sources. Administrative data can replace some survey questions, reduce the burden on respondents, improve the measurement of income and support estimates for small areas, while surveys remain essential for concepts that records do not capture, such as job search, attitudes and unpaid work. Groves (2011) described the current period as a third era of survey research, in which surveys are combined with data generated as a by-product of other activities. Kalton (2019) traced how these developments have changed the practice of official surveys over six decades.
An example
A national statistical office publishes a quarterly labour force estimate based on interviews with 40,000 households. Over ten years, the response rate falls from 75 to 52 per cent, and analysis shows that young adults in rented housing are increasingly under-represented. The office introduces a web questionnaire for the first interview, with telephone follow-up, and adds tenure to its calibration variables. It also links the survey to tax records, with legal authority, to check reported earnings. A parallel run of the old and new designs over a year shows that the unemployment rate differs by less than 0.2 percentage points between them, and the office publishes the comparison so that users can judge the break in the series (illustrative example).
Conclusion
Household surveys are the foundation of many official statistics. Their designs, built on multi-stage probability samples, careful weighting and rigorous quality standards, have produced trusted figures for more than 80 years. Falling response rates, rising costs and measurement error now challenge that model. The future lies in combining well-designed surveys with administrative and other data, so that each source is used for what it measures best.
References
Bailar, B. A. (1975). The effects of rotation group bias on estimates from panel surveys. Journal of the American Statistical Association, 70(349), 23–30. https://doi.org/10.1080/01621459.1975.10480255
Biemer, P. P., & Lyberg, L. E. (2003). Introduction to survey quality. Wiley. https://doi.org/10.1002/0471458740
Bound, J., Brown, C., & Mathiowetz, N. (2001). Measurement error in survey data. In J. J. Heckman & E. Leamer (Eds.), Handbook of econometrics (Vol. 5, pp. 3705–3843). Elsevier. https://doi.org/10.1016/S1573-4412(01)05012-7
Brick, J. M., & Williams, D. (2013). Explaining rising nonresponse rates in cross-sectional surveys. The Annals of the American Academy of Political and Social Science, 645(1), 36–59. https://doi.org/10.1177/0002716212456834
Citro, C. F., & Kalton, G. (Eds.). (2007). Using the American Community Survey: Benefits and challenges. National Academies Press. https://doi.org/10.17226/11901
Citro, C. F. (2014). From multiple modes for surveys to multiple data sources for estimates. Survey Methodology, 40(2), 137–161.
de Leeuw, E., & de Heer, W. (2002). Trends in household survey nonresponse: A longitudinal and international comparison. In R. M. Groves, D. A. Dillman, J. L. Eltinge, & R. J. A. Little (Eds.), Survey nonresponse (pp. 41–54). Wiley.
Deaton, A. (1997). The analysis of household surveys: A microeconometric approach to development policy. Johns Hopkins University Press for the World Bank.
Deville, J.-C., & Särndal, C.-E. (1992). Calibration estimators in survey sampling. Journal of the American Statistical Association, 87(418), 376–382. https://doi.org/10.1080/01621459.1992.10475217
Eurostat. (2017). European statistics code of practice for the national statistical authorities and Eurostat. Publications Office of the European Union.
Fay, R. E., & Herriot, R. A. (1979). Estimates of income for small places: An application of James-Stein procedures to census data. Journal of the American Statistical Association, 74(366), 269–277. https://doi.org/10.1080/01621459.1979.10482505
Fellegi, I. P. (1996). Characteristics of an effective statistical system. International Statistical Review, 64(2), 165–187. https://doi.org/10.2307/1403387
Grosh, M., & Glewwe, P. (Eds.). (2000). Designing household survey questionnaires for developing countries: Lessons from 15 years of the Living Standards Measurement Study (Vols. 1–3). World Bank.
Groves, R. M., & Couper, M. P. (1998). Nonresponse in household interview surveys. Wiley. https://doi.org/10.1002/9781118490082
Groves, R. M. (2011). Three eras of survey research. Public Opinion Quarterly, 75(5), 861–871. https://doi.org/10.1093/poq/nfr057
Hansen, M. H., Hurwitz, W. N., & Madow, W. G. (1953). Sample survey methods and theory (Vols. 1–2). Wiley.
Hansen, M. H., Hurwitz, W. N., Nisselson, H., & Steinberg, J. (1955). The redesign of the Census Current Population Survey. Journal of the American Statistical Association, 50(271), 701–719.
Juster, F. T., Ono, H., & Stafford, F. P. (2003). An assessment of alternative measures of time use. Sociological Methodology, 33(1), 19–54. https://doi.org/10.1111/j.0081-1750.2003.t01-1-00126.x
Kalton, G. (2019). Developments in survey research over the past 60 years: A personal perspective. International Statistical Review, 87(S1), S10–S30. https://doi.org/10.1111/insr.12287
Kish, L. (1965). Survey sampling. Wiley.
Meyer, B. D., Mok, W. K. C., & Sullivan, J. X. (2015). Household surveys in crisis. Journal of Economic Perspectives, 29(4), 199–226. https://doi.org/10.1257/jep.29.4.199
Rao, J. N. K., & Molina, I. (2015). Small area estimation (2nd ed.). Wiley. https://doi.org/10.1002/9781118735855
Särndal, C.-E., Swensson, B., & Wretman, J. (1992). Model assisted survey sampling. Springer. https://doi.org/10.1007/978-1-4612-4378-6
United Nations. (2005). Household sample surveys in developing and transition countries (Studies in Methods, Series F, No. 96). United Nations.