
Surveys · Types and applications
Establishment and Business Surveys: Collecting Data From Organisations
Business surveys collect information from companies and their workplaces rather than from people. This article explains why they need different methods from household surveys, covering skewed populations, sampling, the response process inside organisations, burden, editing and estimation, and the main kinds of business survey.
Much of what is known about the economy comes from surveys of businesses. Monthly figures on retail sales, manufacturing output, job vacancies, wages and investment, and the business confidence indices watched by financial markets, all come from questionnaires completed by companies. These business surveys, also called establishment surveys, follow the same basic logic as surveys of people: a sample is selected, questions are asked and the answers are used to estimate totals for the whole population. But the population, the respondents and the information being collected are so different that business surveys have developed their own methods (Cox et al., 1995; Snijkers et al., 2013).
This article explains what makes business surveys different, and how those differences shape their design.
What business surveys measure
Business surveys fall into two broad groups.
Official economic statistics are produced by national statistical offices and central banks. They include surveys of output, turnover and sales; of employment, hours and earnings; of investment, inventories and research spending; of prices charged and paid; and of international trade in services. Their results feed into national accounts, measures of economic growth, inflation figures and labour market statistics. Many are compulsory by law.
Business tendency surveys, also called business opinion or confidence surveys, ask managers for qualitative judgements: whether output rose, fell or stayed the same last month, whether orders are higher or lower than normal and what they expect in the coming months. Their answers are combined into balances, the share reporting increases minus the share reporting decreases, which are quick to collect and closely follow changes in the economy. Guidelines for such surveys are set out by the OECD (2003). Purchasing managers' indices and the long-running Ifo Business Climate survey in Germany are well-known examples. The Ifo survey has asked thousands of firms about their current situation and expectations every month since 1949, and its microdata are available to researchers (Becker & Wohlrabe, 2008).
Business tendency surveys have several advantages over official quantitative surveys. Their questions are easy to answer, because managers can say whether output rose or fell without consulting accounts. Results are available within days of the end of the month, weeks before official figures. And because they ask about expectations as well as recent changes, they can signal turning points in the economy early. Their limitations are the reverse of these strengths: balances show the direction and breadth of change but not its size, and they need to be calibrated against official figures before they can be used to forecast growth. Central banks and forecasters therefore use them alongside official statistics rather than in place of them.
A third and growing group consists of research surveys of firms, which study topics such as management practices, innovation and the adoption of technology. Bloom and Van Reenen (2007) used structured interviews with managers to measure management practices in thousands of firms across countries, and found that better-managed firms were more productive. Later work extended this approach through a large official survey of management practices in American manufacturing plants (Bloom et al., 2019).
Why business surveys are different
Rivière (2002) set out the features that make business statistics special. The most important are summarised below.
The population is highly skewed
The distribution of businesses by size is extremely uneven. Most businesses are very small, with a handful of employees or none, but a small number of very large companies account for a large share of employment, output and investment. In many countries, firms with 250 or more employees make up less than one per cent of businesses but account for a third or more of employment and an even larger share of turnover. Figure 1 illustrates the pattern.
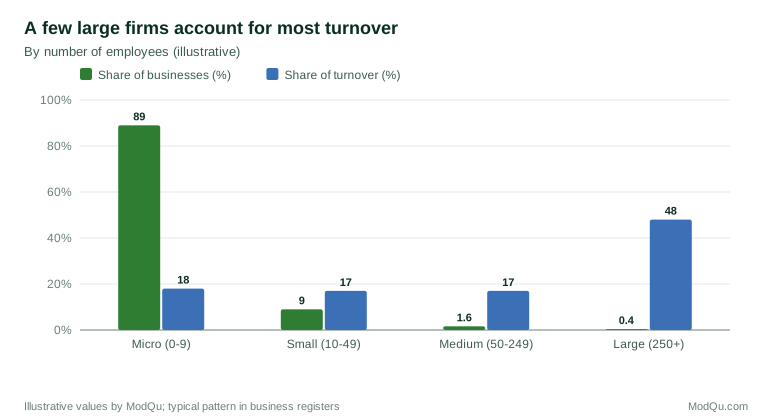
This skew has large consequences for sampling. In a household survey, each person carries roughly equal weight. In a business survey, missing a single very large company can change an estimate of total output by several per cent, while missing a hundred small businesses may make little difference.
The population changes constantly
Businesses are created, merge, split, change their activity, move and close. A list of businesses that was accurate last year will be out of date this year. Keeping the sampling frame up to date is a continuous task.
Units are hard to define
A household or a person is a fairly clear unit. A business is not. A large company may consist of many legal entities, each with several workplaces, and may report different information at different levels: employment for each workplace, turnover for each legal entity, profits for the group as a whole. Statistical offices define a set of statistical units, such as the enterprise, the local unit and the kind-of-activity unit, and must decide for each survey which unit to sample and which to ask for information.
The respondent is an organisation
In a household survey, the person answering usually provides information from their own memory. In a business survey, the respondent is a person acting on behalf of an organisation, often drawing on records kept for other purposes, such as accounts and payroll systems. The questions ask for facts that the organisation holds, not opinions that the respondent holds. This changes the whole response process, as discussed below.
Confidentiality is harder to protect
In household statistics, a table cell based on a few hundred people reveals nothing about any one of them. In business statistics, a cell for a particular industry in a particular region may be dominated by one or two large firms, so that publishing the total would effectively reveal a single company's figures to its competitors. Statistical offices therefore apply dominance rules, which suppress a cell when one or two businesses account for most of its total, and then suppress other cells as needed so that the hidden values cannot be worked out by subtraction (Hundepool et al., 2012). This often limits how much detail can be published for small areas or narrow industries.
Sampling businesses
The business register
Most official business surveys sample from a statistical business register, a list of all businesses maintained by the statistical office and updated from administrative sources such as tax registrations, social security records and company registries. The register records each business's size, activity and location, which are used for stratification. Its quality determines the coverage of every business survey that uses it: businesses that are missing or wrongly classified cannot be correctly sampled.
Stratification and take-all strata
Business samples are stratified by activity and size. Because of the skew, the largest businesses are usually placed in a take-all or completely enumerated stratum, in which every unit is included with certainty (Hidiroglou, 1986). Smaller businesses are sampled at progressively lower rates, and the smallest are sometimes excluded entirely, with their contribution estimated from administrative data. Methods for choosing the boundaries between size strata so as to minimise variance go back to Dalenius and Hodges (1959), and Lavallée and Hidiroglou (1988) adapted them for the highly skewed populations typical of business surveys.
Coordinating samples
Statistical offices run many business surveys, and without care the same small businesses could be selected for several at once while others are never selected. Sample coordination controls this. A common method assigns each business a permanent random number and selects samples by ranges of these numbers. By shifting the range over time, the office can rotate businesses out of a survey after a set period and spread the burden of response across the population, while keeping enough overlap between periods to measure change precisely (Ohlsson, 1995).
The response process inside organisations
Answering a business survey is a different task from answering a household survey. Willimack and Nichols (2010) proposed a hybrid response process model that adds organisational steps to the familiar cognitive steps of comprehension, retrieval, judgement and reporting. Figure 2 shows the main steps.
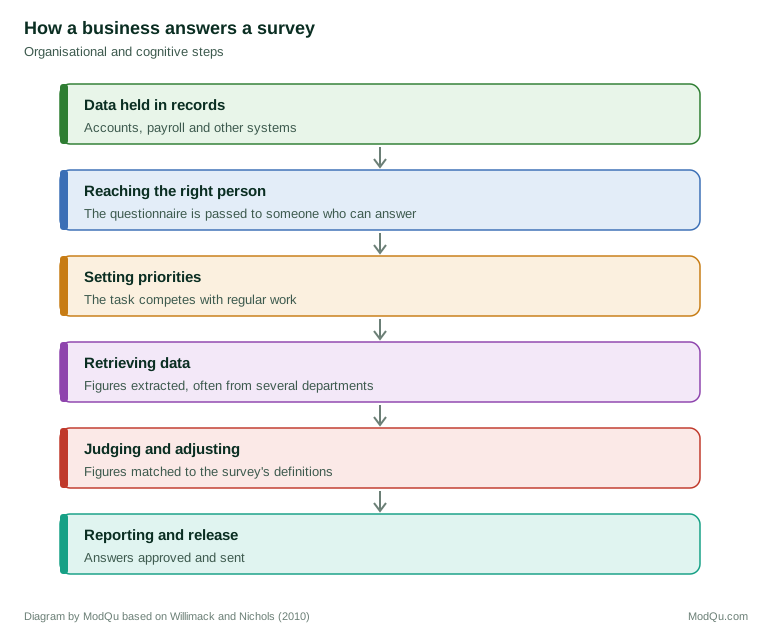
The information must first exist in the business's records. Then the questionnaire must reach someone who can answer it, often after passing through several hands. That person must decide when, and how carefully, to complete it, alongside their regular work. They may need to consult colleagues in other departments, extract figures from accounting systems and adjust those figures to match the survey's definitions, which often differ from the business's own. Finally, the answers may need to be approved by a manager before they are sent. Bavdaž (2010) developed a related model that stresses how the availability of data in records, and the respondent's ability and motivation to retrieve them, determine the quality of answers.
This process explains several common problems. Answers may be late because the person responsible is busy at the end of a financial period. Figures may follow the business's own accounting definitions rather than the survey's. Different people may answer in different periods, causing breaks in a business's series. Questionnaire design therefore pays close attention to whether requested data match what businesses actually keep, to clear definitions and to instructions placed where respondents need them.
Designing business questionnaires
Business questionnaires differ from household ones in several ways. They ask mainly for numbers rather than opinions, often for a specific period such as a calendar month or a financial year, and those numbers usually come from records rather than memory. Good design therefore starts from what businesses actually record. Before a new survey is introduced, statistical offices often visit businesses to learn how their accounts are organised, which figures are easy to produce and which definitions cause difficulty (Snijkers et al., 2013).
Several practices follow from this. Definitions should be stated next to the question they apply to, not in a separate booklet. Questions should ask for figures in the units and periods that businesses use, or allow them to report their own periods and have the statistical office adjust them. Where the survey's definition differs from common accounting practice, the questionnaire should say what to include and exclude, with examples. Electronic questionnaires can check totals as they are entered, show the figures a business reported last time and allow comments explaining unusual changes, all of which reduce later editing.
Response burden and motivation
Businesses, particularly small ones, often complain about the burden of official surveys. Burden has two sides: the actual time and cost of completing questionnaires, and the burden respondents perceive, which depends on how difficult, irrelevant or repetitive the questions seem (Haraldsen, 2004). Statistical offices measure and report burden, and many have targets to reduce it.
Ways of reducing burden include using administrative data instead of asking questions, limiting how long small businesses stay in samples, asking for data in the form businesses already keep, and providing electronic questionnaires that can be completed from accounting software. Motivation also matters. Torres van Grinsven et al. (2014) found that businesses were more willing to respond when they saw the value of the statistics, when the request came from a trusted authority and when they received useful information in return, such as benchmark figures comparing them with their industry.
Nonresponse
Many official business surveys are compulsory, and their response rates are often higher than those of voluntary household surveys. Even so, nonresponse is common among small businesses and in voluntary surveys. Willimack et al. (2002) found that nonresponse in business surveys reflects organisational factors, such as the availability of data and the authority of the respondent, as much as individual reluctance. Phipps and Toth (2012) linked a business survey to administrative records and found that response depended on characteristics such as size and the number of workplaces.
Because of the skew, the response rate alone is a poor guide to quality. A survey in which 60 per cent of businesses respond but all of the largest ones do may cover 95 per cent of the total being estimated. Statistical offices therefore also report weighted response rates, such as the share of total turnover or employment accounted for by respondents (Thompson & Oliver, 2012). Intensive follow-up concentrates on the large businesses whose answers matter most.
Editing and imputation
Business data contain errors such as figures reported in the wrong units, for example in dollars instead of thousands of dollars, totals that do not equal the sum of their parts and values that change implausibly from one period to the next. Editing detects these errors, and imputation fills in missing or rejected values. Automated systems apply consistency rules to each record (Fellegi & Holt, 1976; de Waal et al., 2011).
Because editing is costly, statistical offices concentrate it where it matters. Selective editing ranks suspicious records by their likely effect on published totals and sends only the most influential ones for manual review. Granquist and Kovar (1997) showed that much traditional editing changed the final estimates very little and argued that effort should be focused on errors that affect results.
Estimation and outliers
Estimates of totals use the sampling weights, often combined with auxiliary information from the business register or tax records, such as each business's registered turnover. Ratio and regression estimators that use such information greatly improve precision when the survey variable is closely related to the auxiliary one.
Skewed populations also create problems with outliers. A small business that unexpectedly reports a very large value, perhaps because of a one-off contract, can carry a large weight and distort the estimate for its whole stratum. Robust estimation methods reduce the influence of such values while limiting the bias introduced by doing so (Chambers, 1986).
Timeliness, revisions and seasonal adjustment
Users of economic statistics want results quickly, often within weeks of the end of the period. Business surveys therefore publish a first estimate based on the responses received by a deadline, with imputation for businesses that have not yet replied, and revise it as later responses arrive. Revisions are a normal feature of business statistics, not a sign of error, but they need to be explained. Statistical offices publish the size and direction of past revisions so that users can judge how much the first estimate is likely to change.
Most monthly and quarterly business series also show strong seasonal patterns: retail sales rise before holidays, construction slows in winter and manufacturing output dips during summer shutdowns. To show the underlying trend, statistical offices publish seasonally adjusted series, which remove the regular seasonal pattern and the effects of the number of trading days in each month. Seasonal adjustment is itself revised as new data arrive, because the estimated seasonal pattern depends on the most recent observations. Users comparing one month with the previous one should use the adjusted series, while comparisons with the same month a year earlier can use the unadjusted figures.
Modes and data collection
Business surveys moved early from paper to electronic collection. Web questionnaires are now standard in many countries, and some statistical offices accept data directly from businesses' accounting or payroll software. Telephone follow-up is used for nonresponse and to check unusual figures. For the largest businesses, statistical offices may assign a dedicated contact who manages the relationship across all surveys. Principles of questionnaire design developed for surveys of individuals, such as clear visual layout and logical ordering of questions, apply to business questionnaires as well (Dillman et al., 2014).
New data sources
Statistical offices are increasingly replacing or supplementing business surveys with other data. Tax and payroll records can provide turnover and employment for nearly all businesses, often more quickly and with less burden than a survey. Scanner data from retailers can replace price collection for many goods, and electronic transaction data can provide early estimates of consumer spending. Struijs et al. (2014) discussed the opportunities and difficulties that such sources create for official statistics, including questions of access, definitions and continuity. Surveys remain essential for information that records do not contain, such as expectations, investment plans and management practices.
An example
A statistical office runs a monthly survey of retail sales. Its register lists 60,000 retailers. The 300 largest, which account for 55 per cent of sales, are included every month. The remaining businesses are stratified by size and type of shop, and 4,000 are sampled, each staying in the sample for 15 months before rotating out. Response among the largest retailers is 98 per cent and among the smallest 68 per cent, giving a weighted response rate of 91 per cent of sales. Selective editing sends about 120 records a month for review, mostly from large retailers whose figures changed sharply. Estimates use registered turnover from tax records as an auxiliary variable, which reduces the standard error of the monthly total by about half compared with a simple weighted estimate (illustrative example).
Conclusion
Business surveys follow the same principles as other surveys, but the nature of businesses changes how those principles are applied. Skewed populations call for take-all strata and weighted response rates. Constantly changing populations need well-maintained registers. Organisational respondents call for questionnaires that match business records, attention to burden and selective editing of influential values. Understanding these differences is essential both for those who produce business statistics and for those who use them.
References
Bavdaž, M. (2010). The multidimensional integral business survey response model. Survey Methodology, 36(1), 81–93.
Becker, S. O., & Wohlrabe, K. (2008). Micro data at the Ifo Institute for Economic Research: The "Ifo Business Survey", usage and access. Schmollers Jahrbuch: Journal of Applied Social Science Studies, 128(2), 307–319.
Bloom, N., & Van Reenen, J. (2007). Measuring and explaining management practices across firms and countries. Quarterly Journal of Economics, 122(4), 1351–1408. https://doi.org/10.1162/qjec.2007.122.4.1351
Bloom, N., Brynjolfsson, E., Foster, L., Jarmin, R., Patnaik, M., Saporta-Eksten, I., & Van Reenen, J. (2019). What drives differences in management practices? American Economic Review, 109(5), 1648–1683. https://doi.org/10.1257/aer.20170491
Chambers, R. L. (1986). Outlier robust finite population estimation. Journal of the American Statistical Association, 81(396), 1063–1069. https://doi.org/10.1080/01621459.1986.10478374
Cox, B. G., Binder, D. A., Chinnappa, B. N., Christianson, A., Colledge, M. J., & Kott, P. S. (Eds.). (1995). Business survey methods. Wiley. https://doi.org/10.1002/9781118150504
Dalenius, T., & Hodges, J. L., Jr. (1959). Minimum variance stratification. Journal of the American Statistical Association, 54(285), 88–101. https://doi.org/10.1080/01621459.1959.10501501
de Waal, T., Pannekoek, J., & Scholtus, S. (2011). Handbook of statistical data editing and imputation. Wiley. https://doi.org/10.1002/9780470904848
Dillman, D. A., Smyth, J. D., & Christian, L. M. (2014). Internet, phone, mail, and mixed-mode surveys: The tailored design method (4th ed.). Wiley.
Fellegi, I. P., & Holt, D. (1976). A systematic approach to automatic edit and imputation. Journal of the American Statistical Association, 71(353), 17–35. https://doi.org/10.1080/01621459.1976.10481472
Granquist, L., & Kovar, J. G. (1997). Editing of survey data: How much is enough? In L. Lyberg, P. Biemer, M. Collins, E. de Leeuw, C. Dippo, N. Schwarz, & D. Trewin (Eds.), Survey measurement and process quality (pp. 415–435). Wiley. https://doi.org/10.1002/9781118490013.ch18
Haraldsen, G. (2004). Identifying and reducing response burdens in internet business surveys. Journal of Official Statistics, 20(2), 393–410.
Hidiroglou, M. A. (1986). The construction of a self-representing stratum of large units in survey design. The American Statistician, 40(1), 27–31. https://doi.org/10.1080/00031305.1986.10475350
Hundepool, A., Domingo-Ferrer, J., Franconi, L., Giessing, S., Schulte Nordholt, E., Spicer, K., & de Wolf, P.-P. (2012). Statistical disclosure control. Wiley. https://doi.org/10.1002/9781118348239
Lavallée, P., & Hidiroglou, M. A. (1988). On the stratification of skewed populations. Survey Methodology, 14(1), 33–43.
OECD. (2003). Business tendency surveys: A handbook. OECD Publishing.
Ohlsson, E. (1995). Coordination of samples using permanent random numbers. In B. G. Cox, D. A. Binder, B. N. Chinnappa, A. Christianson, M. J. Colledge, & P. S. Kott (Eds.), Business survey methods (pp. 153–169). Wiley.
Phipps, P., & Toth, D. (2012). Analyzing establishment nonresponse using an interpretable regression tree model with linked administrative data. Annals of Applied Statistics, 6(2), 772–794. https://doi.org/10.1214/11-AOAS521
Rivière, P. (2002). What makes business statistics special? International Statistical Review, 70(1), 145–159. https://doi.org/10.1111/j.1751-5823.2002.tb00353.x
Snijkers, G., Haraldsen, G., Jones, J., & Willimack, D. K. (2013). Designing and conducting business surveys. Wiley. https://doi.org/10.1002/9781118447895
Struijs, P., Braaksma, B., & Daas, P. J. H. (2014). Official statistics and Big Data. Big Data & Society, 1(1). https://doi.org/10.1177/2053951714538417
Thompson, K. J., & Oliver, B. E. (2012). Response rates in business surveys: Going beyond the usual performance measure. Journal of Official Statistics, 28(2), 221–237.
Torres van Grinsven, V., Bolko, I., & Bavdaž, M. (2014). In search of motivation for the business survey response task. Journal of Official Statistics, 30(4), 579–606. https://doi.org/10.2478/jos-2014-0037
Willimack, D. K., & Nichols, E. (2010). A hybrid response process model for business surveys. Journal of Official Statistics, 26(1), 3–24.
Willimack, D. K., Nichols, E., & Sudman, S. (2002). Understanding unit and item nonresponse in business surveys. In R. M. Groves, D. A. Dillman, J. L. Eltinge, & R. J. A. Little (Eds.), Survey nonresponse (pp. 213–227). Wiley.