
Surveys · Nonresponse, weighting and data quality
Detecting Careless and Inattentive Responding in Online Surveys
Some online survey respondents answer without reading or thinking. This article explains how careless responding affects data and describes the main methods for detecting it, from completion times to attention checks, and how to use them fairly.
In every online survey, some respondents answer without paying attention. They click through pages quickly, choose the same option repeatedly or select answers at random. This is called careless responding, or insufficient effort responding (Huang et al., 2012). Estimates of its prevalence vary widely, but several studies have found that it affects roughly one in ten respondents in typical online samples, and more in some (Meade & Craig, 2012; Ward & Meade, 2023).
Careless responses are not just noise. Because they do not reflect respondents' true views, they can distort averages, weaken or strengthen correlations and create spurious results. Even a small share of careless respondents can change the conclusions of a study (Maniaci & Rogge, 2014). Detecting them is therefore an important part of cleaning online survey data.
The effects depend on the questions. On a scale where most careful respondents answer near one end, random answers pull the average towards the middle. On a scale where careful answers are spread out, a block of identical answers can create apparent agreement between items that are in fact unrelated. In product and market research, careless responses can make weak concepts look acceptable and strong ones look ordinary, because random answers narrow the differences between options. Huang et al. (2012) showed that even modest rates of insufficient effort responding can alter the measured structure of questionnaires, for example by inflating or deflating the correlations used to check whether a set of items measures one concept.
Methods of detection
Researchers use several kinds of indicator, summarised in Figure 1 (Meade & Craig, 2012; Curran, 2016).
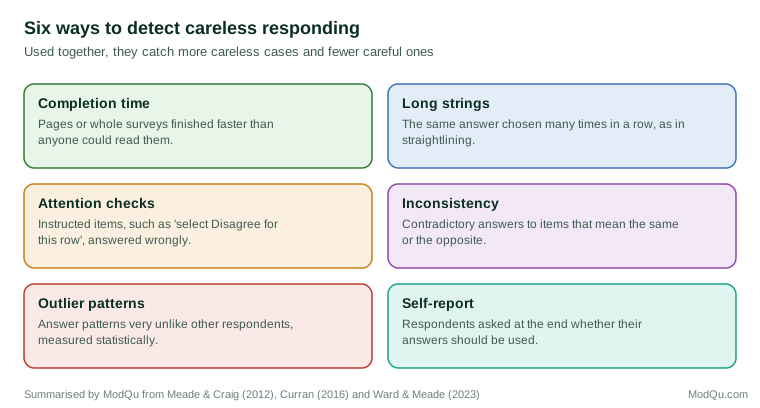
Completion time. Respondents who finish a page or a whole survey much faster than a careful reader could are likely not reading the questions. A common rule flags respondents whose completion time is below a threshold, such as a third or a half of the median time, or below an estimate of the minimum reading time (Zhang & Conrad, 2014; Greszki et al., 2015).
Long-string analysis. This counts the longest run of identical answers. A respondent who chooses the same option for twenty consecutive items, including items worded in opposite directions, is unlikely to have read them (Johnson, 2005; Kim et al., 2019).
Attention checks. These are items that a careful respondent will answer in a particular way. Instructed response items tell respondents which answer to choose, such as "Please select 'Strongly disagree' for this item". Instructional manipulation checks hide an instruction in a longer block of text (Oppenheimer et al., 2009).
Consistency indices. Pairs of items with similar meaning should receive similar answers, and pairs with opposite meaning should receive opposite answers. Large inconsistencies across many pairs suggest careless responding (Meade & Craig, 2012).
Outlier statistics. Statistical measures, such as the Mahalanobis distance, identify response patterns that are very unusual compared with the rest of the sample (Curran, 2016).
Self-report. Asking respondents at the end whether they answered carefully and whether their data should be used can identify some careless respondents, although those least engaged may not answer honestly (Meade & Craig, 2012).
Using indicators well
No single indicator detects all careless respondents, and each flags some careful ones. Fast readers may trip a time threshold; people with consistent views may give long strings of the same answer; a single missed attention check may reflect a lapse rather than general carelessness. Researchers therefore recommend using several indicators together, flagging respondents who fail more than one, and choosing thresholds before looking at the results (Curran, 2016; DeSimone et al., 2015).
Removing flagged respondents can also introduce bias. Careless responding is more common among some groups, such as younger respondents and those with less interest in the topic, so excluding them can change the composition of the sample (Greszki et al., 2015). A sensible approach is to report how many respondents were flagged by each indicator, to show results with and without exclusions, and to adjust weights if exclusions alter the sample's make-up.
Prevention
Detection works best alongside prevention. Short questionnaires, clear and engaging questions, fewer large grids and an explanation of why careful answers matter all reduce carelessness (Ward & Meade, 2023). Telling respondents that their answers will be checked for quality can also help, although warnings should be worded so that they do not discourage genuine respondents (Huang et al., 2012).
An example
An online survey of 2,000 consumers includes two instructed response items, a pair of reversed questions and page timing. The team decides in advance to flag respondents who fail both attention checks, finish in less than a third of the median time, or give identical answers to all 15 items in the main grid. Of 2,000 respondents, 140 meet at least one of these rules, and 60 meet two or more. The team removes the 60, keeps the others with a flag, and reports that excluding the full 140 would change none of the main findings by more than two percentage points (illustrative example).
Conclusion
Careless responding is a common feature of online surveys that can distort results. Completion times, long strings, attention checks, consistency indices, outlier statistics and self-reports each help to detect it. Used together, with thresholds set in advance and with attention to who is excluded, they allow researchers to improve data quality without discarding careful respondents.
References
Curran, P. G. (2016). Methods for the detection of carelessly invalid responses in survey data. Journal of Experimental Social Psychology, 66, 4–19. https://doi.org/10.1016/j.jesp.2015.07.006
DeSimone, J. A., Harms, P. D., & DeSimone, A. J. (2015). Best practice recommendations for data screening. Journal of Organizational Behavior, 36(2), 171–181. https://doi.org/10.1002/job.1962
Greszki, R., Meyer, M., & Schoen, H. (2015). Exploring the effects of removing "too fast" responses and respondents from web surveys. Public Opinion Quarterly, 79(2), 471–503. https://doi.org/10.1093/poq/nfu058
Huang, J. L., Curran, P. G., Keeney, J., Poposki, E. M., & DeShon, R. P. (2012). Detecting and deterring insufficient effort responding to surveys. Journal of Business and Psychology, 27(1), 99–114. https://doi.org/10.1007/s10869-011-9231-8
Johnson, J. A. (2005). Ascertaining the validity of individual protocols from web-based personality inventories. Journal of Research in Personality, 39(1), 103–129. https://doi.org/10.1016/j.jrp.2004.09.009
Kim, Y., Dykema, J., Stevenson, J., Black, P., & Moberg, D. P. (2019). Straightlining: Overview of measurement, comparison of indicators, and effects in mail–web mixed-mode surveys. Social Science Computer Review, 37(2), 214–233. https://doi.org/10.1177/0894439317752406
Maniaci, M. R., & Rogge, R. D. (2014). Caring about carelessness: Participant inattention and its effects on research. Journal of Research in Personality, 48, 61–83. https://doi.org/10.1016/j.jrp.2013.09.008
Meade, A. W., & Craig, S. B. (2012). Identifying careless responses in survey data. Psychological Methods, 17(3), 437–455. https://doi.org/10.1037/a0028085
Oppenheimer, D. M., Meyvis, T., & Davidenko, N. (2009). Instructional manipulation checks: Detecting satisficing to increase statistical power. Journal of Experimental Social Psychology, 45(4), 867–872. https://doi.org/10.1016/j.jesp.2009.03.009
Ward, M. K., & Meade, A. W. (2023). Dealing with careless responding in survey data: Prevention, identification, and recommended best practices. Annual Review of Psychology, 74, 577–596. https://doi.org/10.1146/annurev-psych-040422-045007
Zhang, C., & Conrad, F. G. (2014). Speeding in web surveys: The tendency to answer very fast and its association with straightlining. Survey Research Methods, 8(2), 127–135. https://doi.org/10.18148/srm/2014.v8i2.5453