
Surveys · Sampling
Design Effects and Effective Sample Size in Complex Surveys
The design effect measures how much a survey's design changes precision compared with a simple random sample, and the effective sample size translates this into an equivalent number of interviews. This article explains where design effects come from, how to calculate and use them, and why they matter for anyone reading survey results.
A survey report says that 2,000 people were interviewed. Many readers will assume that the results have the precision of 2,000 randomly chosen people, with a margin of error of about ±2.2 percentage points. For most real surveys, this is wrong. Clustering, weighting and other design features usually make estimates less precise than a simple random sample of the same size, sometimes much less. The design effect measures this difference, and the effective sample size expresses it as an equivalent number of simple random interviews (Kish, 1965).
Definitions
The design effect, often written deff, is the ratio of the variance of an estimate under the actual design to its variance under a simple random sample of the same size (Kish, 1965):
deff = variance under the actual design ÷ variance under simple random sampling
A design effect of 1 means the design is as precise as simple random sampling. A value of 2 means the variance is twice as large, so standard errors are about 1.41 times larger. A value below 1 means the design is more precise, as can happen with effective stratification. The idea of comparing a complex design with simple random sampling goes back to the early theory of survey sampling, in which the variance of clustered and stratified designs was expressed relative to that of a simple random sample (Hansen et al., 1953; Cochran, 1977). Kish gave the ratio its name and made it a routine tool for designers.
The effective sample size is the actual sample size divided by the design effect. A survey of 2,000 with a design effect of 2 has an effective sample size of 1,000: it is as precise as a simple random sample of 1,000 (Kish, 1995).
Where design effects come from
Clustering
When interviews are concentrated in clusters, such as areas, schools or stores, people within each cluster tend to resemble each other. The approximate design effect from clustering is 1 + (m − 1)ρ, where m is the average number of interviews per cluster and ρ is the intra-cluster correlation (Kish, 1965). Even small values of ρ produce large design effects when clusters are big.
Weighting
When respondents have different weights, whether from unequal selection probabilities or from adjustments for nonresponse, the variance of estimates increases. Kish (1992) gave a widely used approximation for the design effect from weighting: 1 + CV², where CV is the coefficient of variation of the weights. Weights that vary a lot, for example because some groups were heavily over-sampled or had very low response, produce large design effects. Gabler et al. (1999) provided a model-based justification for combining the effects of weighting and clustering by multiplying them.
Stratification
Stratification usually reduces variance. With proportionate allocation, the design effect from stratification is at or slightly below 1, and the gain is larger when strata differ strongly on the survey variables. Disproportionate allocation can reduce variance for the variables it targets but increase it for others, through the weighting effect (Kish, 1965; Lohr, 2022).
A worked illustration
Figure 1 shows the effective sample size of 2,000 interviews under different design features. Weighting with a coefficient of variation of 0.6 gives a design effect of 1.36 and an effective sample of about 1,470. Clustering with 20 interviews per cluster and ρ of 0.05 gives a design effect of 1.95 and an effective sample of about 1,030. Together, the design effect is about 2.65, and the 2,000 interviews are equivalent to about 750 randomly selected respondents (illustrative calculation).
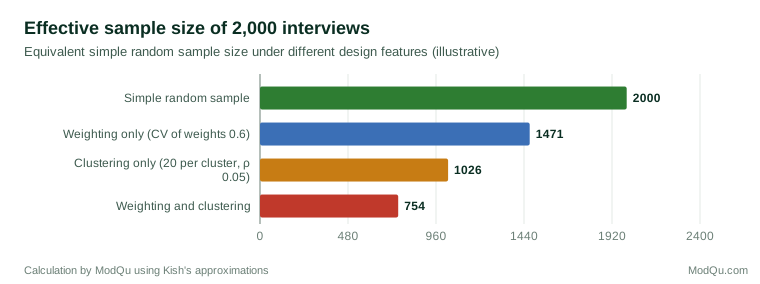
The margin of error for a proportion of 50 per cent would then be about ±3.6 points rather than ±2.2. A report that quoted the simple random sample figure would overstate precision considerably.
Design effects vary
There is no single design effect for a survey. Each estimate has its own, because ρ differs between variables. Characteristics that are strongly geographic, such as housing tenure or ethnicity, usually have higher design effects in area-clustered samples than personal attitudes. Design effects for subgroups are often smaller than for the whole sample, because fewer interviews from each cluster fall in the subgroup. Design effects for differences and regression coefficients can also differ from those for means (Kish & Frankel, 1974; Skinner et al., 1989).
Using design effects
In planning
Designers use design effects from previous surveys to decide the sample size needed for a target precision. If a margin of ±3 points requires about 1,070 interviews under simple random sampling and the expected design effect is 1.5, about 1,600 interviews are needed. Cross-national survey programmes use predicted design effects to set sample sizes so that each country achieves a similar effective sample size, even though their designs differ (Lynn et al., 2007).
In analysis
For analysis, it is better to calculate standard errors directly from the design than to apply an average design effect. Survey software does this using the strata, clusters and weights, through linearisation or replication methods (Wolter, 2007; Lumley, 2010). Analyses that ignore the design and treat the data as a simple random sample usually understate standard errors and can find "significant" differences that are not real (Skinner et al., 1989).
In reporting
Good practice is to report the design effect or effective sample size for key estimates, or to state that margins of error account for the design. Kish (1995) argued that publishing design effects helps users judge precision and helps future designers plan. Readers of commercial reports should ask whether margins of error include the effect of weighting.
Design effects in weighted online samples
Design effects are not only a feature of probability surveys. Online panel and quota samples are almost always weighted to match population totals, and when the raw sample differs a lot from the population, the weights vary widely. The resulting design effect from weighting can be large, so the effective sample size of a weighted online poll may be much smaller than its number of interviews. Some polling organisations now report a margin of error that includes this weighting effect (Baker et al., 2013). This adjustment reflects only the variability of the weights; it does not measure any bias that remains because of how the sample was obtained.
Precision is not accuracy
A design effect describes variance, not bias. A survey with a design effect of 1, a large sample and a narrow margin of error can still be badly wrong if its frame misses part of the population, if many sampled people do not respond, or if questions are misunderstood. The total survey error framework places sampling variance alongside these other sources of error, and reminds designers that money spent reducing the design effect is money not spent on reducing other errors (Groves et al., 2009). Design effects help readers judge how precise an estimate is; they do not show whether it is right.
Reading a survey report
When a report gives a sample size and a margin of error, a reader can check whether the design has been taken into account. For a proportion near 50 per cent, a simple random sample of n has a 95 per cent margin of about 98 ÷ √n percentage points. If a report of 2,000 interviews quotes ±2.2 points, it has probably ignored the design. If it quotes ±3 or ±3.5 points, it has probably included a design effect of around 2 to 2.5. Where no information is given, readers should assume that the real uncertainty is greater than the simple formula suggests.
Reducing design effects
Design effects can be kept down by spreading the sample across more clusters with fewer interviews in each, by stratifying effectively, by avoiding extreme over-sampling and by keeping weights from varying more than necessary. Weight trimming, which limits very large weights, reduces variance at the risk of some bias, and calibration methods can improve precision by using auxiliary information (Kalton & Flores-Cervantes, 2003; Valliant et al., 2018).
Conclusion
The design effect is a simple way to describe how a survey's design changes precision, and the effective sample size translates it into terms anyone can understand. Clustering and weighting usually increase variance, while stratification usually reduces it. Because design effects differ between estimates, analysis should use methods that account for the full design, and reports should make clear what precision the sample really provides. A sample of 2,000 is not always worth 2,000 random interviews, and readers deserve to know the difference (Kish, 1965, 1995).
References
Baker, R., Brick, J. M., Bates, N. A., Battaglia, M., Couper, M. P., Dever, J. A., Gile, K. J., & Tourangeau, R. (2013). Summary report of the AAPOR task force on non-probability sampling. Journal of Survey Statistics and Methodology, 1(2), 90–143. https://doi.org/10.1093/jssam/smt008
Cochran, W. G. (1977). Sampling techniques (3rd ed.). Wiley.
Gabler, S., Häder, S., & Lahiri, P. (1999). A model based justification of Kish's formula for design effects for weighting and clustering. Survey Methodology, 25(1), 105–106.
Groves, R. M., Fowler, F. J., Jr., Couper, M. P., Lepkowski, J. M., Singer, E., & Tourangeau, R. (2009). Survey methodology (2nd ed.). Wiley.
Hansen, M. H., Hurwitz, W. N., & Madow, W. G. (1953). Sample survey methods and theory (Vols. 1–2). Wiley.
Kalton, G., & Flores-Cervantes, I. (2003). Weighting methods. Journal of Official Statistics, 19(2), 81–97.
Kish, L., & Frankel, M. R. (1974). Inference from complex samples. Journal of the Royal Statistical Society: Series B (Methodological), 36(1), 1–37. https://doi.org/10.1111/j.2517-6161.1974.tb00981.x
Kish, L. (1965). Survey sampling. Wiley.
Kish, L. (1992). Weighting for unequal P<sub>i</sub>. Journal of Official Statistics, 8(2), 183–200.
Kish, L. (1995). Methods for design effects. Journal of Official Statistics, 11(1), 55–77.
Lohr, S. L. (2022). Sampling: Design and analysis (3rd ed.). CRC Press. https://doi.org/10.1201/9780429298899
Lumley, T. (2010). Complex surveys: A guide to analysis using R. Wiley. https://doi.org/10.1002/9780470580066
Lynn, P., Häder, S., Gabler, S., & Laaksonen, S. (2007). Methods for achieving equivalence of samples in cross-national surveys: The European Social Survey experience. Journal of Official Statistics, 23(1), 107–124.
Skinner, C. J., Holt, D., & Smith, T. M. F. (Eds.). (1989). Analysis of complex surveys. Wiley.
Valliant, R., Dever, J. A., & Kreuter, F. (2018). Practical tools for designing and weighting survey samples (2nd ed.). Springer. https://doi.org/10.1007/978-3-319-93632-1
Wolter, K. M. (2007). Introduction to variance estimation (2nd ed.). Springer. https://doi.org/10.1007/978-0-387-35099-8