
Surveys · Technology and the future
Cross-National Harmonization of Survey Measures for Comparative Knowledge
Comparing survey results between countries requires measures that mean the same thing everywhere. This article explains input and output harmonization, the role of international classifications for variables such as education and occupation, how to harmonize attitude measures and how to check whether harmonization has worked.
Comparative survey research asks questions such as: Are people in one country more satisfied with democracy than in another? Does the link between education and income differ between countries? Has trust in institutions changed more in some places than others? Answering them requires survey measures that are harmonized: designed or adjusted so that the same concept is measured in a comparable way in every country.
Harmonization is harder than it looks. Countries differ in languages, institutions, education systems, labour markets and cultural norms. A question about "secondary education" or "the police" refers to different realities in different places. This article explains the main approaches to harmonization, the special case of background variables, the challenges of attitude measures and how to check whether harmonization has succeeded.
Why harmonization matters
Comparisons between countries are among the most widely reported survey results. Rankings of happiness, trust, health or skills attract attention from governments, businesses and the media, and they can influence policy. If the measures behind them are not comparable, the rankings can mislead. A country may appear to have unusually low trust because a key word was translated with a stronger meaning, or unusually few graduates because its qualifications were classified differently.
Differences in method can be as important as differences in measures. Smith (2011) pointed out that in comparative research, every source of survey error, from coverage and nonresponse to measurement and processing, can differ between countries, and these differences can combine to create or hide real differences. Harmonization therefore covers the whole survey process, not only the questions.
Input and output harmonization
There are two broad strategies, summarised in Figure 1 (Granda et al., 2010; Ehling, 2003).
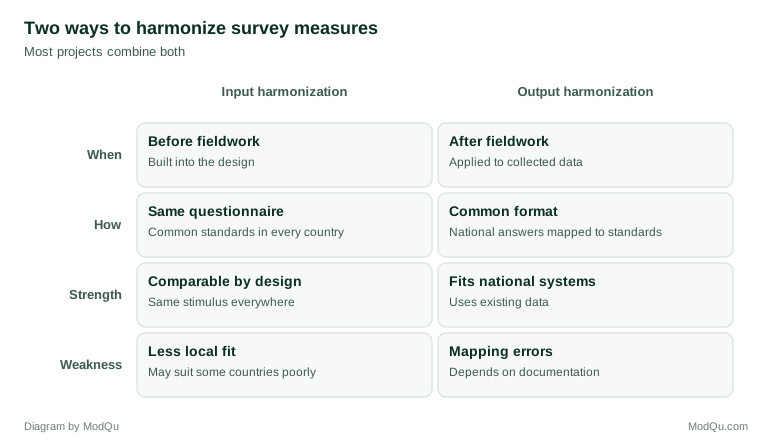
Input harmonization means designing the survey to be comparable from the start. All countries use the same questionnaire, translated with care, the same sampling standards and the same fieldwork procedures. Major international surveys, such as the European Social Survey, follow this approach, with a central team setting specifications and checking compliance (Jowell et al., 2007).
Output harmonization means taking measures that were collected differently in each country and converting them afterwards into a common format. This is common for background variables such as education and occupation, where each country asks questions that fit its own system, and the answers are then coded to an international classification. It is also used when combining existing national surveys that were not designed to be compared.
Many projects combine both. Kish (1994) described the range of designs for surveys of several populations and argued that comparability depends on careful decisions at every stage, from sampling to analysis. Lynn et al. (2007) showed how the European Social Survey achieved comparable samples across countries by setting common standards, such as the use of probability sampling and a minimum effective sample size, while allowing each country to use the best sampling frame available.
Background variables and international classifications
Variables such as education, occupation, income and household composition are central to comparative analysis. They are also among the hardest to harmonize, because the underlying systems differ between countries (Hoffmeyer-Zlotnik & Wolf, 2003).
Education. School systems differ in the number of years, the types of schools and the qualifications awarded. Asking simply about "years of schooling" or "highest qualification" in the same words everywhere produces answers that cannot be compared. The usual solution is to ask about qualifications in each country's own terms and then map them to the International Standard Classification of Education (ISCED), which defines levels from early childhood education to doctoral study (UNESCO Institute for Statistics, 2012).
Occupation. Job titles differ between countries and languages. Respondents describe their work in their own words, and coders assign each answer to the International Standard Classification of Occupations (ISCO), which groups jobs by the tasks and skill level involved (International Labour Office, 2012).
Income. Currencies, price levels, tax systems and the definition of household income differ. Comparisons often use relative measures, such as income position within each country, or adjust for purchasing power.
Output harmonization of background variables depends on good national questions, detailed documentation of national systems and trained coders. Errors in mapping national categories to international ones can create artificial differences between countries.
Harmonizing attitude and opinion measures
Attitude questions raise different problems. Here the goal is usually input harmonization: the same question, translated to preserve its meaning, using a team translation process (Harkness et al., 2010). But even with excellent translation, several issues remain.
Concepts may differ. A concept such as "democracy", "family" or "corruption" may carry different meanings in different countries. Researchers must decide whether a concept is comparable at all, and if so, how to define it so that questions in every country refer to the same thing (van de Vijver & Leung, 1997).
Response styles differ. Respondents in some countries tend to use the extremes of scales, while others prefer the middle or tend to agree with statements regardless of content (Johnson et al., 2005). These differences can create apparent differences between countries in the concept being measured.
Reference points differ. People judge their own situation against others around them. A respondent asked to rate their health as "good" or "poor" may use a different standard in a country with high life expectancy than in one with low. King et al. (2004) developed anchoring vignettes to address this: respondents rate short descriptions of hypothetical people, as well as themselves, and their ratings of the fixed vignettes show how they use the scale, so that self-ratings can be adjusted.
Checking whether harmonization worked
Harmonization should be tested, not assumed. Several checks are available:
- Measurement invariance testing. Statistical tests examine whether a set of questions measures the same concept in the same way in each country, at increasing levels of strictness (Davidov et al., 2014; Steenkamp & Baumgartner, 1998). Only when the strictest relevant level holds can average scores be compared directly. When full invariance does not hold, newer methods such as alignment allow approximate comparisons across many countries (Asparouhov & Muthén, 2014).
- Comparison with external benchmarks. Harmonized background variables can be compared with official statistics for each country, such as the distribution of education levels.
- Cognitive testing in each country. Asking respondents in each country how they understood the questions can show whether concepts are interpreted similarly.
- Documentation review. Detailed records of national questions, translations and coding decisions allow analysts to trace unexpected results to their sources.
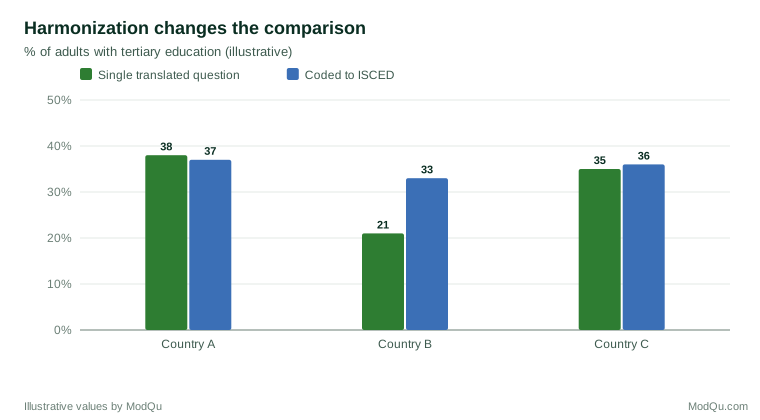
Figure 2 illustrates how harmonized and unharmonized measures of education can lead to different conclusions.
Organising comparative projects
Harmonization depends on how a project is organised. Successful comparative surveys usually have a central coordinating team that sets specifications, provides the source questionnaire and translation guidance, monitors fieldwork and checks data. National teams adapt and implement the survey in each country and report any deviations from the specifications. Regular communication between the central and national teams allows problems to be raised and resolved before fieldwork rather than discovered afterwards (Jowell et al., 2007).
A balance is needed between standardization and local fit. Requiring identical methods everywhere can force countries to use designs that work poorly in their circumstances, such as a sampling frame that does not exist or a mode that respondents do not accept. Allowing too much local freedom undermines comparability. The usual solution is to standardize the outcome, such as the quality of the sample or the meaning of a question, while allowing flexibility in how each country achieves it (Lynn et al., 2007; Johnson et al., 2018).
Comparative projects also require shared documentation. Data users in one country need to know how a variable was measured in every other country. Many large comparative surveys publish detailed national technical reports, questionnaires in every language and the code used to harmonize variables, so that analysts can judge comparability for themselves.
Harmonizing over time
Harmonization is also needed when comparing surveys over time. Questions, classifications and survey methods change, and a series can break when they do. When ISCO or ISCED is revised, for example, earlier data may need to be recoded to the new version, or a link between the versions must be estimated. Wolf et al. (2016) discuss harmonization across both cultures and time and stress that the same principles apply: clear definitions, careful documentation and testing of comparability.
Combining existing surveys
A growing area is ex-post harmonization, which combines existing national or international surveys that were designed separately. This allows comparisons across more countries and longer periods than any single project. It requires detailed mapping of questions and response categories, and analysts must account for differences in samples, modes and question wording that cannot be removed. Granda et al. (2010) describe the steps involved, from identifying comparable variables to documenting every transformation.
Practical guidance
- Define concepts first. Agree what each measure is meant to capture before writing questions.
- Use international classifications for background variables. Ask national questions and map them to ISCED, ISCO and similar standards.
- Translate with a team process. Use parallel translation, review and adjudication rather than a single translator.
- Set common standards for samples and fieldwork, while allowing countries to adapt methods to local conditions.
- Test comparability. Use cognitive interviews, invariance tests and benchmarks.
- Document everything. Record national questions, translations, coding decisions and deviations from standards, so that users can judge comparability (Survey Research Center, 2016).
An example
An international employer runs an engagement survey in twelve countries. In the first year, it asks "How many years of education have you completed?" and finds that one country appears to have far fewer graduates than the others. Investigation shows that in that country, many degrees are completed in three years and vocational qualifications are counted differently. In the second year, the company asks about qualifications in national terms and codes them to ISCED, and the apparent difference largely disappears. Invariance tests of the engagement scale show that one item, about loyalty, functions differently in two countries, so the company reports comparisons using the remaining items. It also adds a short note to its report explaining both changes, so that managers understand why some country results differ from the previous year for reasons of measurement rather than real change (illustrative example).
Conclusion
Comparative knowledge depends on comparable measures. Input harmonization designs comparability into the survey from the start; output harmonization creates it afterwards by mapping national measures to common standards. Background variables rely on international classifications, while attitude measures depend on careful translation and testing for response style and reference point differences. In every case, harmonization should be documented and tested rather than assumed. With these practices, cross-national surveys can generate knowledge that is truly comparable across countries and over time.
References
Asparouhov, T., & Muthén, B. (2014). Multiple-group factor analysis alignment. Structural Equation Modeling, 21(4), 495–508. https://doi.org/10.1080/10705511.2014.919210
Davidov, E., Meuleman, B., Cieciuch, J., Schmidt, P., & Billiet, J. (2014). Measurement equivalence in cross-national research. Annual Review of Sociology, 40, 55–75. https://doi.org/10.1146/annurev-soc-071913-043137
Ehling, M. (2003). Harmonising data in official statistics: Development, procedures, and data quality. In J. H. P. Hoffmeyer-Zlotnik & C. Wolf (Eds.), Advances in cross-national comparison: A European working book for demographic and socio-economic variables (pp. 17–31). Kluwer Academic/Plenum Publishers.
Granda, P., Wolf, C., & Hadorn, R. (2010). Harmonizing survey data. In J. A. Harkness, M. Braun, B. Edwards, T. P. Johnson, L. Lyberg, P. Ph. Mohler, B.-E. Pennell, & T. W. Smith (Eds.), Survey methods in multinational, multiregional, and multicultural contexts (pp. 315–332). Wiley.
Harkness, J. A., Braun, M., Edwards, B., Johnson, T. P., Lyberg, L., Mohler, P. Ph., Pennell, B.-E., & Smith, T. W. (Eds.). (2010). Survey methods in multinational, multiregional, and multicultural contexts. Wiley. https://doi.org/10.1002/9780470609927
Hoffmeyer-Zlotnik, J. H. P., & Wolf, C. (Eds.). (2003). Advances in cross-national comparison: A European working book for demographic and socio-economic variables. Kluwer Academic/Plenum Publishers.
International Labour Office. (2012). International Standard Classification of Occupations: ISCO-08. International Labour Office.
Johnson, T., Kulesa, P., Cho, Y. I., & Shavitt, S. (2005). The relation between culture and response styles: Evidence from 19 countries. Journal of Cross-Cultural Psychology, 36(2), 264–277. https://doi.org/10.1177/0022022104272905
Johnson, T. P., Pennell, B.-E., Stoop, I. A. L., & Dorer, B. (Eds.). (2018). Advances in comparative survey methods: Multinational, multiregional, and multicultural contexts (3MC). Wiley. https://doi.org/10.1002/9781118884997
Jowell, R., Roberts, C., Fitzgerald, R., & Eva, G. (Eds.). (2007). Measuring attitudes cross-nationally: Lessons from the European Social Survey. SAGE. https://doi.org/10.4135/9781849209458
King, G., Murray, C. J. L., Salomon, J. A., & Tandon, A. (2004). Enhancing the validity and cross-cultural comparability of measurement in survey research. American Political Science Review, 98(1), 191–207. https://doi.org/10.1017/S000305540400108X
Kish, L. (1994). Multipopulation survey designs: Five types with seven shared aspects. International Statistical Review, 62(2), 167–186. https://doi.org/10.2307/1403507
Lynn, P., Häder, S., Gabler, S., & Laaksonen, S. (2007). Methods for achieving equivalence of samples in cross-national surveys: The European Social Survey experience. Journal of Official Statistics, 23(1), 107–124.
Smith, T. W. (2011). Refining the total survey error perspective. International Journal of Public Opinion Research, 23(4), 464–484. https://doi.org/10.1093/ijpor/edq052
Steenkamp, J.-B. E. M., & Baumgartner, H. (1998). Assessing measurement invariance in cross-national consumer research. Journal of Consumer Research, 25(1), 78–90. https://doi.org/10.1086/209528
Survey Research Center. (2016). Guidelines for best practice in cross-cultural surveys. Survey Research Center, Institute for Social Research, University of Michigan. https://ccsg.isr.umich.edu/
UNESCO Institute for Statistics. (2012). International Standard Classification of Education: ISCED 2011. UNESCO Institute for Statistics.
van de Vijver, F., & Leung, K. (1997). Methods and data analysis for cross-cultural research. SAGE.
Wolf, C., Schneider, S. L., Behr, D., & Joye, D. (2016). Harmonizing survey questions between cultures and over time. In C. Wolf, D. Joye, T. W. Smith, & Y. Fu (Eds.), The SAGE handbook of survey methodology (pp. 502–524). SAGE.