
Surveys · Technology and the future
Integrating Big Data Indicators with Traditional Survey Measures
Search queries, social media posts, online prices, phone records and satellite images can all serve as indicators of social and economic conditions. This article explains how such big data indicators are combined with survey measures, what each contributes, the errors to watch for and the main methods of integration.
Every day, people leave traces of their activity in digital systems. They search the web, post on social media, buy goods online, make calls and move through areas photographed by satellites. These traces can be turned into indicators: counts, rates or scores that track something of interest, such as unemployment, consumer confidence, prices or poverty. Because they are produced continuously and cheaply, big data indicators promise faster and more detailed information than surveys, which are slow and expensive.
Yet experience has shown that big data indicators can be misleading when used alone. They are not designed to measure a population, and their relationship to the concepts researchers care about can shift without warning. The most productive approach has been to integrate them with traditional survey measures, using each to strengthen the other (Japec et al., 2015). This article explains how.
Types of big data indicators
Figure 1 summarises common sources of big data indicators and the survey measures they are often compared with.
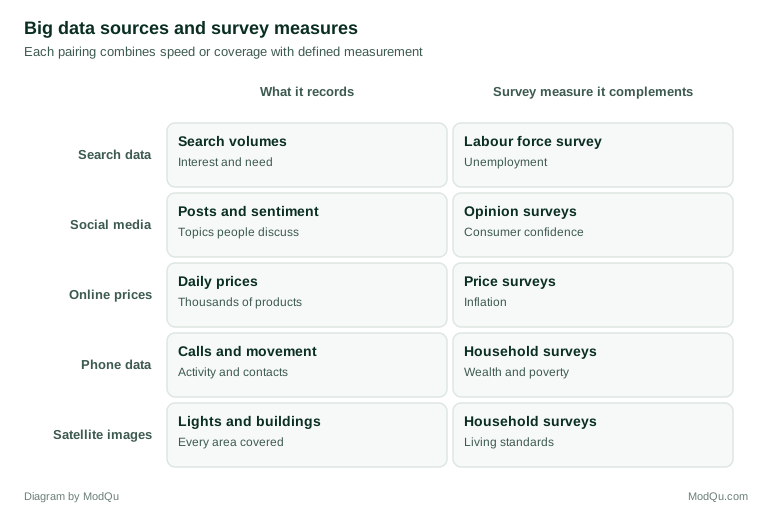
Search data. The number of searches for terms related to a topic can indicate public interest or need. Choi and Varian (2012) showed that search data helped predict current values of economic indicators, such as retail sales and unemployment claims, before official figures were released, a practice they called "predicting the present".
Social media. Posts can be analysed for topics and sentiment. O'Connor et al. (2010) found that sentiment in posts about the economy tracked consumer confidence measured by surveys for a period. Schober et al. (2016) reviewed such comparisons and found that agreement between social media measures and survey measures was inconsistent, varying by topic and over time.
Online prices. Prices collected automatically from online shops can produce price indices daily. Cavallo and Rigobon (2016) described a project that collected prices from hundreds of retailers in many countries and showed that online price indices tracked official inflation statistics closely in most countries.
Mobile phone data. Records of calls and phone use reflect patterns of movement and social contact. Blumenstock et al. (2015) combined phone records with a small survey in Rwanda to predict household wealth for millions of phone users.
Satellite images. Images of night-time lights, buildings and roads reflect economic activity. Jean et al. (2016) trained machine learning models on satellite images and survey data to estimate poverty in several African countries.
What can go wrong with big data indicators
The best-known warning is Google Flu Trends. Ginsberg et al. (2009) showed that searches for flu-related terms could estimate influenza activity in the United States faster than official surveillance. A few years later, the system substantially overestimated flu levels. Lazer et al. (2014) identified two problems: the model had been fitted to search terms that happened to correlate with flu during the training period, and changes to the search engine itself altered search behaviour. They called the belief that big data can replace traditional data collection and analysis "big data hubris".
Several kinds of error affect big data indicators (Japec et al., 2015; Amaya et al., 2020):
- Coverage. Only some people search, post or buy online, and they differ from those who do not.
- Changing systems. Platforms change their design, algorithms and user base, altering the data without any change in the underlying behaviour.
- Unclear meaning. A search for "unemployment benefits" might come from someone who lost a job, someone helping a relative or a journalist.
- Manipulation and automated accounts. Social media data can include bots and coordinated campaigns.
- Volume is not accuracy. Meng (2018) showed that a very large data set with a small selection bias can be less accurate than a small random sample. Large size does not cure bias.
These problems are why surveys, with defined populations, known selection procedures and stable questions, remain essential as a benchmark.
Ways to integrate the two
Validation and benchmarking
The simplest form of integration uses surveys to check big data indicators. If an indicator based on online job advertisements is to be used as a measure of labour demand, it should be compared with survey measures over time to see whether the two move together. Checking should continue, because relationships that held in the past can break down.
Nowcasting
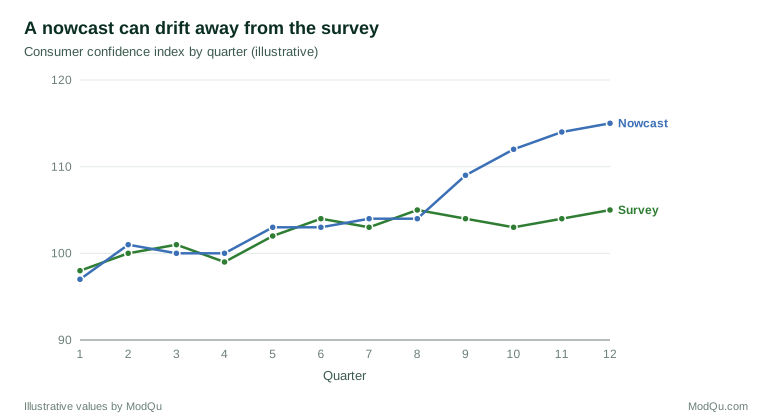
Nowcasting uses big data indicators to estimate current values of a survey measure before the survey results are available. A model is fitted to the past relationship between the survey measure and the indicator. When new indicator data arrive, the model produces an early estimate, which is replaced by the survey figure when it is published (Choi & Varian, 2012). The survey remains the authoritative measure, and the indicator provides an early signal.
Figure 2 illustrates how a nowcast can track a survey measure and where it can go wrong.
Small area estimation
Surveys often have too few respondents to give reliable estimates for small areas, such as districts or towns. Small area estimation combines survey data with auxiliary information available for every area, using statistical models to borrow strength across areas (Fay & Herriot, 1979; Rao & Molina, 2015). Traditionally, the auxiliary information came from censuses and administrative records. Big data indicators, such as satellite measures of buildings or mobile phone activity, can serve the same role. The studies by Blumenstock et al. (2015) and Jean et al. (2016) follow this logic: surveys provide the measurement of wealth or poverty, and big data provide coverage of every area.
Calibration and weighting
Survey estimates can be adjusted so that they agree with known totals for the population. Where big data provide reliable totals, such as numbers of transactions or visitors, they can be used in this way. Equally, survey estimates can be used to correct the coverage biases of big data sources.
Combining in official statistics
Statistical agencies are exploring how to use big data alongside surveys in official statistics. Struijs et al. (2014) described the opportunities and challenges, including access to privately held data, quality assessment and maintaining public trust. Citro (2014) and Beaumont (2020) argued that surveys will remain essential but increasingly as one source among several, combined through statistical models.
Access, ethics and continuity
Many big data sources are owned by private companies. Access may depend on commercial agreements that can be withdrawn, priced out of reach or changed at short notice. An indicator built on a source that disappears leaves a gap in the series, which is one more reason to keep a survey benchmark running. Statistical agencies have pointed to the need for stable legal and contractual arrangements before relying on such data for official figures (Struijs et al., 2014).
Big data also raise ethical questions. The people whose searches, posts, phone records or movements generate an indicator did not agree to take part in research. Even when data are aggregated, researchers should consider whether their use could harm the people or communities involved, for example by revealing sensitive information about small areas or groups. Surveys, by contrast, rest on informed participation. When the two are combined, the higher standard should generally apply.
Uses in market and business research
Businesses combine the two kinds of data routinely. A company may track sales, website traffic and social media mentions daily, and run surveys of customers every quarter. The behavioural data show what customers do; the surveys show why, and how customers who are not visible in the company's own data see the brand. Using the surveys to interpret and calibrate the behavioural data, rather than treating either source alone as the full picture, follows the same logic as integration in official statistics.
A framework for quality
The total survey error framework, which describes all the ways a survey estimate can differ from the truth, has been extended to big data and to combined estimates (Biemer, 2010; Amaya et al., 2020). Applying it means asking, for each source: who is covered, what is measured, how it is processed, and how errors in one source might combine with errors in another. Kitchin (2014) cautioned against the view that big data speak for themselves; data are always produced by particular systems for particular purposes, and their meaning must be interpreted.
Practical guidance
- Start from the concept. Decide what you want to measure, then ask whether a big data source measures it, or only something related.
- Keep a survey benchmark. Continue a survey measure, even a small one, to validate and calibrate the indicator.
- Monitor the relationship. Check regularly whether the indicator still tracks the survey measure, and investigate any divergence.
- Know the source. Understand how the data are generated, who is included and how the platform has changed.
- Report uncertainty. Nowcasts and model-based estimates are uncertain. Report their margins of error and how they were produced.
- Avoid overfitting. Choose indicators for clear substantive reasons, not because they happened to correlate in the past (Lazer et al., 2014).
An example
A regional development agency wants monthly estimates of consumer confidence, but its survey is quarterly. It builds a nowcast using an index of online searches for large purchases and sentiment in local news coverage. For two years, the nowcast tracks the quarterly survey closely. Then a search engine changes how it suggests search terms, and the index rises sharply without any change in the survey. Because the agency compares the nowcast with each new survey result, it detects the divergence at the next quarter, refits the model and adds a note to its publications explaining the break. It also decides to add a short monthly online question on confidence to an existing panel, so that the nowcast can be checked every month rather than every quarter (illustrative example).
Conclusion
Big data indicators offer speed, detail and coverage that surveys cannot match, but they are shaped by the systems that produce them and can drift away from the concepts they are meant to measure. Surveys offer defined populations, stable measures and known error properties. Integrating the two, through validation, nowcasting, small area estimation and careful modelling, combines their strengths. The survey remains the anchor that keeps big data indicators honest.
References
Amaya, A., Biemer, P. P., & Kinyon, D. (2020). Total error in a big data world: Adapting the TSE framework to big data. Journal of Survey Statistics and Methodology, 8(1), 89–119. https://doi.org/10.1093/jssam/smz056
Beaumont, J.-F. (2020). Are probability surveys bound to disappear for the production of official statistics? Survey Methodology, 46(1), 1–28.
Biemer, P. P. (2010). Total survey error: Design, implementation, and evaluation. Public Opinion Quarterly, 74(5), 817–848. https://doi.org/10.1093/poq/nfq058
Blumenstock, J., Cadamuro, G., & On, R. (2015). Predicting poverty and wealth from mobile phone metadata. Science, 350(6264), 1073–1076. https://doi.org/10.1126/science.aac4420
Cavallo, A., & Rigobon, R. (2016). The Billion Prices Project: Using online prices for measurement and research. Journal of Economic Perspectives, 30(2), 151–178. https://doi.org/10.1257/jep.30.2.151
Choi, H., & Varian, H. (2012). Predicting the present with Google Trends. Economic Record, 88(S1), 2–9. https://doi.org/10.1111/j.1475-4932.2012.00809.x
Citro, C. F. (2014). From multiple modes for surveys to multiple data sources for estimates. Survey Methodology, 40(2), 137–161.
Fay, R. E., & Herriot, R. A. (1979). Estimates of income for small places: An application of James-Stein procedures to census data. Journal of the American Statistical Association, 74(366), 269–277. https://doi.org/10.1080/01621459.1979.10482505
Ginsberg, J., Mohebbi, M. H., Patel, R. S., Brammer, L., Smolinski, M. S., & Brilliant, L. (2009). Detecting influenza epidemics using search engine query data. Nature, 457(7232), 1012–1014. https://doi.org/10.1038/nature07634
Japec, L., Kreuter, F., Berg, M., Biemer, P., Decker, P., Lampe, C., Lane, J., O'Neil, C., & Usher, A. (2015). Big data in survey research: AAPOR task force report. Public Opinion Quarterly, 79(4), 839–880. https://doi.org/10.1093/poq/nfv039
Jean, N., Burke, M., Xie, M., Davis, W. M., Lobell, D. B., & Ermon, S. (2016). Combining satellite imagery and machine learning to predict poverty. Science, 353(6301), 790–794. https://doi.org/10.1126/science.aaf7894
Kitchin, R. (2014). Big Data, new epistemologies and paradigm shifts. Big Data & Society, 1(1). https://doi.org/10.1177/2053951714528481
Lazer, D., Kennedy, R., King, G., & Vespignani, A. (2014). The parable of Google Flu: Traps in big data analysis. Science, 343(6176), 1203–1205. https://doi.org/10.1126/science.1248506
Meng, X.-L. (2018). Statistical paradises and paradoxes in big data (I): Law of large populations, big data paradox, and the 2016 US presidential election. The Annals of Applied Statistics, 12(2), 685–726. https://doi.org/10.1214/18-AOAS1161SF
O'Connor, B., Balasubramanyan, R., Routledge, B. R., & Smith, N. A. (2010). From tweets to polls: Linking text sentiment to public opinion time series. In Proceedings of the Fourth International AAAI Conference on Weblogs and Social Media (pp. 122–129). AAAI Press.
Rao, J. N. K., & Molina, I. (2015). Small area estimation (2nd ed.). Wiley. https://doi.org/10.1002/9781118735855
Schober, M. F., Pasek, J., Guggenheim, L., Lampe, C., & Conrad, F. G. (2016). Social media analyses for social measurement. Public Opinion Quarterly, 80(1), 180–211. https://doi.org/10.1093/poq/nfv048
Struijs, P., Braaksma, B., & Daas, P. J. H. (2014). Official statistics and Big Data. Big Data & Society, 1(1). https://doi.org/10.1177/2053951714538417