
Surveys · Technology and the future
The Future of Survey Research in a Low-Response World
Response rates to surveys have fallen for decades, and costs have risen. This article reviews what the decline means for survey quality, the evidence that low response does not always mean high bias and the main directions in which survey research is adapting, from new designs to combining surveys with other data.
For several decades, fewer and fewer people have agreed to take part in surveys. Telephone polls that once reached a majority of the people they called now often complete interviews with fewer than one in ten. Face-to-face government surveys, long the most reliable source of social statistics, have seen steady declines despite greater fieldwork effort. Online panels depend on people who agree to join and keep answering. These trends raise a fundamental question: can surveys still produce trustworthy knowledge when most people do not respond?
This article reviews the evidence on falling response, explains what it means and does not mean for survey quality, and describes the main ways in which survey research is adapting.
The decline in response
Declining response has been documented across countries, modes and types of survey. In a comparison of official household surveys in many countries, de Leeuw and de Heer (2002) found that response rates were falling in most of them, through both more refusals and more people who could not be contacted. Luiten et al. (2020) updated this work and found that the decline continued into the twenty-first century, even as fieldwork effort increased. In the United States, Williams and Brick (2018) documented falling response and rising effort in major face-to-face household surveys, and telephone surveys have shown even steeper declines (Brick & Williams, 2013).
Figure 1 illustrates the typical long-term pattern.
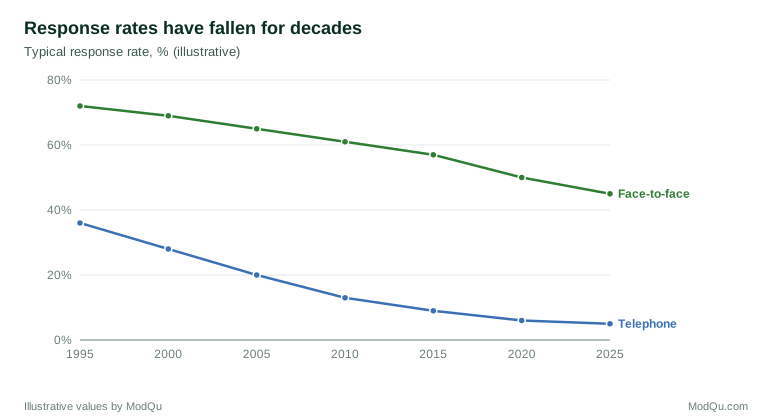
The reasons include busier lives, more people living alone, distrust of institutions, concern about privacy, the flood of commercial calls, messages and requests for feedback, and technologies that make it easy to screen out unknown callers (Brick & Williams, 2013; National Research Council, 2013). Survey requests now compete with many other demands on people's attention.
Low response does not always mean high bias
Low response is a warning sign, but it is not the same as inaccurate results. Nonresponse bias occurs only when the people who respond differ from those who do not on the things the survey measures. Groves (2006) and Groves and Peytcheva (2008) analysed studies in which bias could be measured directly and found that the response rate was a poor predictor of bias. Surveys with similar response rates had very different levels of bias, and most of the variation in bias was between estimates within the same survey.
Experiments support this conclusion. Keeter et al. (2006) compared a standard telephone survey with a much more rigorous version that achieved a far higher response rate and found few meaningful differences in results. A later study by the Pew Research Center found that telephone surveys with response rates under 10 per cent still produced accurate estimates for many measures, such as demographics and political attitudes, but over-represented people who were civically engaged, such as volunteers (Keeter et al., 2017).
The lesson is that falling response makes bias possible, not certain. It increases the importance of understanding who is missing and why, and of checking survey estimates against independent benchmarks.
Where low response does cause harm
Some estimates are clearly vulnerable. Meyer et al. (2015) found that in major American household surveys, nonresponse to whole interviews and to individual questions, together with inaccurate reports, had grown, and that survey measures of income and government benefits had become less accurate when compared with administrative records. Topics closely linked to the decision to respond, such as civic engagement, volunteering or interest in the survey topic, are especially at risk. Small groups and hard-to-reach populations may be badly under-represented.
Low response also raises costs. More contact attempts, larger incentives and larger initial samples are needed to achieve a given number of interviews. Those costs have pushed many organisations towards cheaper online methods, which bring their own risks.
How survey research is adapting
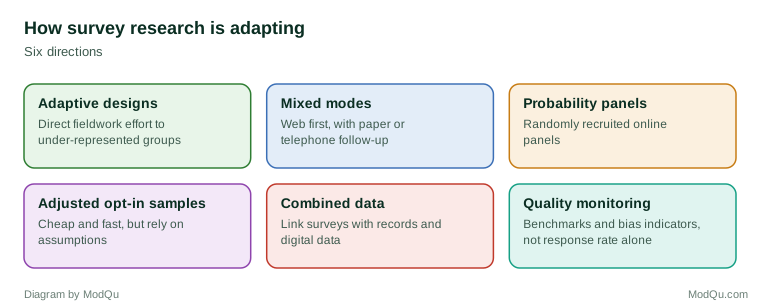
Figure 2 summarises the main directions of adaptation.
Smarter fieldwork
Adaptive and responsive designs use information collected during fieldwork to direct effort where it does the most good, for example by targeting groups that are under-represented among early respondents rather than simply maximising the overall response rate (Tourangeau et al., 2017). The aim shifts from a high response rate to a balanced, representative set of respondents.
Mixed modes
Many surveys now combine modes, such as a web questionnaire followed by paper or telephone follow-up for people who do not respond online. Mixed-mode designs can reach more people at lower cost, though differences in how people answer in different modes must be managed (Couper, 2017).
Probability-based online panels
Panels recruited by random sampling, for example by letters sent to a sample of addresses, combine the representativeness of probability sampling with the speed and low cost of online data collection. Members who do not have internet access can be given access or surveyed by another mode.
Nonprobability samples with adjustment
Online opt-in samples are cheap and fast but are not drawn at random. Their accuracy depends on statistical adjustment and on the assumptions behind it (Baker et al., 2013). Comparisons have found that nonprobability samples are often less accurate than probability samples, even those with low response rates, though the gap varies by topic and method (Dutwin & Buskirk, 2017). They also face growing problems with fraudulent and careless respondents (Kennedy et al., 2020).
Combining surveys with other data
Perhaps the biggest shift is towards combining surveys with administrative records, transaction data and digital data. Groves (2011) described this as the start of a new era in which surveys would be one source among several. Citro (2014) argued that official statistics should move from multiple survey modes to multiple data sources, using surveys for what only they can measure and other sources for the rest. Beaumont (2020) considered whether probability surveys would disappear from official statistics and concluded that they remain essential, both in their own right and as a benchmark for evaluating and adjusting other sources. Big data bring their own errors and must be evaluated as carefully as surveys (Japec et al., 2015).
Treating respondents as partners
Another response to falling participation is to make taking part more worthwhile and less burdensome. Shorter questionnaires, designs that work well on phones, clear explanations of why the survey matters and what will be done with the results, and fair incentives all help. Some organisations now share results with respondents, so that people can see how their answers contributed. Trust is central: people are more willing to take part when they believe the organisation asking is legitimate, will protect their data and will use the results responsibly (National Research Council, 2013).
This approach reflects a broader change in how survey researchers think about participation. Respondents are not a resource to be extracted at the lowest cost per interview, but people who are giving their time. Surveys that respect this are more likely to keep the goodwill on which all survey research depends.
Better monitoring of quality
Instead of relying on the response rate alone, researchers increasingly monitor indicators of how representative respondents are, compare estimates with external benchmarks and report on the risk of bias for key estimates (National Research Council, 2013).
What surveys still do best
Many things can be measured without asking people: purchases, movements, website visits and many official records. But there is much that cannot. Attitudes, beliefs, intentions, experiences, reasons and identities are known only to the people who hold them. Surveys are also often the only way to measure the whole population, including people who leave few digital traces. Brick (2011) and Couper (2013) both argued that surveys will continue to play a central role, even as their methods change, because they measure things other data do not.
The future of survey research is therefore not a choice between surveys and other data, but a combination in which surveys are designed more carefully, targeted more precisely and linked with other sources where possible.
Skills for the next generation
These changes require new skills. Survey researchers increasingly need to understand statistical modelling for nonprobability samples, methods for linking and combining data sources, the processing of digital data and the legal and ethical rules that govern data sharing. At the same time, the traditional skills of survey methodology, careful questionnaire design, sampling and the analysis of error, become more important, not less, because they provide the standards against which new sources and methods are judged.
What this means for users of survey results
For people who use survey results, a low-response world calls for some habits:
- Do not judge a survey by its response rate alone. Ask how the sample was drawn, what adjustments were made and whether results have been checked against benchmarks.
- Pay attention to topics linked to participation. Estimates of civic engagement, interest in the topic or willingness to help may be biased upwards.
- Look for transparency. Good survey providers disclose their methods, response rates and weighting, and explain the limitations of their data.
- Compare sources. Where several surveys or data sources measure the same thing, consistency across them gives more confidence than any single result.
An example
A city council has run an annual resident survey by telephone for twenty years. Its response rate has fallen from 40 per cent to 6 per cent, and costs have tripled. The council redesigns the survey: it sends letters with a web link to a random sample of addresses, follows up non-respondents with a paper questionnaire, and offers a small incentive. It checks the results against census figures on age, tenure and household size, and weights to correct remaining differences. The new design achieves a 22 per cent response rate at lower cost. In the first year, it runs alongside the old telephone survey, so that the council can measure how much results change because of the new design rather than real change in residents' views. Satisfaction with council services is about four points lower in the new design, mostly because it reaches more younger renters, a group the telephone survey had increasingly missed. The council publishes both sets of results with an explanation, so that the break in the series is clear to readers (illustrative example).
Conclusion
Falling response is one of the most serious challenges survey research has faced. But low response does not automatically mean poor results, and the field is adapting through smarter fieldwork, mixed modes, probability panels, better adjustment and the combination of surveys with other data. Surveys remain the only way to measure many things that matter, from opinions to experiences. Their future depends on designing them carefully, understanding who is missing and being open about the limits of what they show.
References
Baker, R., Brick, J. M., Bates, N. A., Battaglia, M., Couper, M. P., Dever, J. A., Gile, K. J., & Tourangeau, R. (2013). Summary report of the AAPOR task force on non-probability sampling. Journal of Survey Statistics and Methodology, 1(2), 90–143. https://doi.org/10.1093/jssam/smt008
Beaumont, J.-F. (2020). Are probability surveys bound to disappear for the production of official statistics? Survey Methodology, 46(1), 1–28.
Brick, J. M., & Williams, D. (2013). Explaining rising nonresponse rates in cross-sectional surveys. The Annals of the American Academy of Political and Social Science, 645(1), 36–59. https://doi.org/10.1177/0002716212456834
Brick, J. M. (2011). The future of survey sampling. Public Opinion Quarterly, 75(5), 872–888. https://doi.org/10.1093/poq/nfr045
Citro, C. F. (2014). From multiple modes for surveys to multiple data sources for estimates. Survey Methodology, 40(2), 137–161.
Couper, M. P. (2013). Is the sky falling? New technology, changing media, and the future of surveys. Survey Research Methods, 7(3), 145–156. https://doi.org/10.18148/srm/2013.v7i3.5751
Couper, M. P. (2017). New developments in survey data collection. Annual Review of Sociology, 43, 121–145. https://doi.org/10.1146/annurev-soc-060116-053613
de Leeuw, E., & de Heer, W. (2002). Trends in household survey nonresponse: A longitudinal and international comparison. In R. M. Groves, D. A. Dillman, J. L. Eltinge, & R. J. A. Little (Eds.), Survey nonresponse (pp. 41–54). Wiley.
Dutwin, D., & Buskirk, T. D. (2017). Apples to oranges or gala versus golden delicious? Comparing data quality of nonprobability internet samples to low response rate probability samples. Public Opinion Quarterly, 81(S1), 213–239. https://doi.org/10.1093/poq/nfw061
Groves, R. M., & Peytcheva, E. (2008). The impact of nonresponse rates on nonresponse bias: A meta-analysis. Public Opinion Quarterly, 72(2), 167–189. https://doi.org/10.1093/poq/nfn011
Groves, R. M. (2006). Nonresponse rates and nonresponse bias in household surveys. Public Opinion Quarterly, 70(5), 646–675. https://doi.org/10.1093/poq/nfl033
Groves, R. M. (2011). Three eras of survey research. Public Opinion Quarterly, 75(5), 861–871. https://doi.org/10.1093/poq/nfr057
Japec, L., Kreuter, F., Berg, M., Biemer, P., Decker, P., Lampe, C., Lane, J., O'Neil, C., & Usher, A. (2015). Big data in survey research: AAPOR task force report. Public Opinion Quarterly, 79(4), 839–880. https://doi.org/10.1093/poq/nfv039
Keeter, S., Hatley, N., Kennedy, C., & Lau, A. (2017). What low response rates mean for telephone surveys. Pew Research Center. https://www.pewresearch.org/methods/2017/05/15/what-low-response-rates-mean-for-telephone-surveys/
Keeter, S., Kennedy, C., Dimock, M., Best, J., & Craighill, P. (2006). Gauging the impact of growing nonresponse on estimates from a national RDD telephone survey. Public Opinion Quarterly, 70(5), 759–779. https://doi.org/10.1093/poq/nfl035
Kennedy, C., Hatley, N., Lau, A., Mercer, A., Keeter, S., Ferno, J., & Asare-Marfo, D. (2020). Assessing the risks to online polls from bogus respondents. Pew Research Center.
Luiten, A., Hox, J., & de Leeuw, E. (2020). Survey nonresponse trends and fieldwork effort in the 21st century: Results of an international study across countries and surveys. Journal of Official Statistics, 36(3), 469–487. https://doi.org/10.2478/jos-2020-0025
Meyer, B. D., Mok, W. K. C., & Sullivan, J. X. (2015). Household surveys in crisis. Journal of Economic Perspectives, 29(4), 199–226. https://doi.org/10.1257/jep.29.4.199
National Research Council. (2013). Nonresponse in social science surveys: A research agenda (R. Tourangeau & T. J. Plewes, Eds.). The National Academies Press. https://doi.org/10.17226/18293
Tourangeau, R., Brick, J. M., Lohr, S., & Li, J. (2017). Adaptive and responsive survey designs: A review and assessment. Journal of the Royal Statistical Society: Series A, 180(1), 203–223. https://doi.org/10.1111/rssa.12186
Williams, D., & Brick, J. M. (2018). Trends in US face-to-face household survey nonresponse and level of effort. Journal of Survey Statistics and Methodology, 6(2), 186–211. https://doi.org/10.1093/jssam/smx019