
Surveys · Nonresponse, weighting and data quality
Calibration of Self-Reported Survey Data Against Objective Benchmarks
People's reports of their own behaviour, income and health often differ from records and measurements. This article explains how survey researchers compare self-reports with objective benchmarks, what the comparisons typically show and how estimates can be adjusted.
Much survey knowledge rests on self-reports: people's own accounts of how often they exercise, how much they drink, whether they voted and what they earn. Self-reports are often the only practical source of such information, but they are not always accurate. Respondents forget, estimate, round, misunderstand questions and sometimes present themselves in a favourable light (Tourangeau & Yan, 2007). Where independent information exists, such as official records, sales figures or physical measurements, survey researchers can compare self-reports with these benchmarks and, in some cases, adjust survey estimates to account for the differences.
What benchmarks are available
Benchmarks come from several kinds of source:
- Administrative records, such as electoral rolls showing who voted, tax and benefit records, and hospital records.
- Aggregate statistics, such as alcohol and tobacco sales, which show total consumption in a population.
- Physical measurement, such as measured height and weight or physical activity recorded by accelerometers.
- Validation studies, in which a subsample of respondents is linked to records or measured directly.
Aggregate benchmarks allow comparison of totals and averages. Linked records and validation studies allow comparison at the level of individuals, which shows who misreports and by how much (Bound et al., 2001).
What the comparisons show
The direction and size of the gap depend on the topic. Figure 1 illustrates typical patterns.
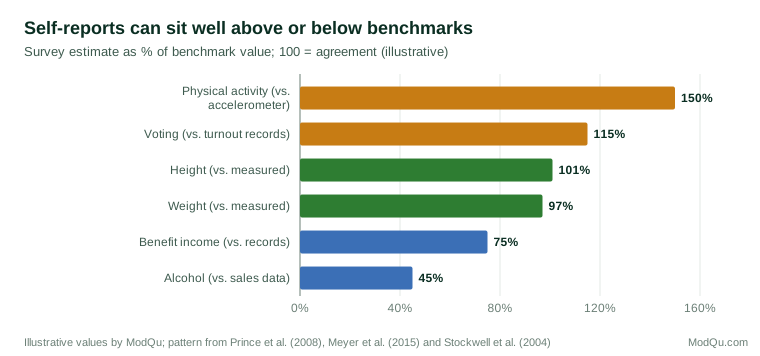
Voting is consistently over-reported. Surveys typically find more people saying they voted than official turnout figures show. Studies matching survey respondents to electoral records found that over-reporting was more common among people who valued voting, including more educated respondents (Silver et al., 1986; Bernstein et al., 2001). Ansolabehere and Hersh (2012) matched a large survey to commercial voter files and confirmed substantial over-reporting.
Physical activity is over-reported relative to measurement. A systematic review by Prince et al. (2008) found that self-reported activity was often higher than activity measured with devices, with wide variation between studies.
Height and weight are reported with smaller but systematic errors: people tend to over-report height and under-report weight, so that self-reported body mass index understates the prevalence of obesity (Connor Gorber et al., 2007).
Alcohol consumption reported in surveys typically accounts for only a fraction of alcohol sold. Stockwell et al. (2004) compared survey measures with sales data and found that even the best-performing questions covered well under the total.
Income and benefits are under-reported in many household surveys. Moore et al. (2000) reviewed evidence on income measurement error, and Meyer et al. (2015) showed that the reporting of government transfer payments in major surveys in the United States had declined over time, with substantial shares of benefits missing.
Why self-reports differ
Several processes produce these gaps. Social desirability leads respondents to over-report approved behaviours, such as voting and exercise, and under-report disapproved ones, such as drinking (Tourangeau & Yan, 2007). Memory errors cause events to be forgotten or placed in the wrong period. Estimation replaces counting for frequent behaviours, and the strategies people use can produce systematic bias. Some differences reflect definitions: a survey's concept of income or physical activity may not match the benchmark's. And some differences reflect nonresponse or coverage: heavy drinkers or non-voters may be less likely to take part in surveys at all (Bernstein et al., 2001).
Who misreports
Misreporting is rarely uniform across the population, which matters for analysis as well as for totals. Over-reporting of voting is concentrated among people who value voting or feel that they ought to have voted, so that relationships between education and turnout look stronger in survey data than in records (Bernstein et al., 2001; Silver et al., 1986). Under-reporting of weight is larger among people with higher measured weight (Connor Gorber et al., 2007). When errors differ between groups in this way, a single correction factor applied to everyone can leave comparisons between groups biased. Validation studies with linked individual data are therefore more informative than aggregate comparisons, because they show how the size of the error varies with respondents' characteristics (Bound et al., 2001).
Linking survey answers to records
Individual-level validation usually requires linking survey answers to administrative records, which in most countries requires respondents' consent. Not everyone agrees, and those who consent may differ from those who do not, so that validation results apply most directly to consenters. Sakshaug and Kreuter (2012) examined linked survey and administrative data and found that bias from non-consent was generally small compared with nonresponse and measurement error, but not absent. Linkage also depends on accurate identifying information and on clear agreements about data protection.
Benchmarks in business and market research
Commercial surveys face the same issues. Reported purchases can be compared with a client's sales or loyalty-card records, reported media use with measured audience data and reported intentions with later behaviour. Stated purchase intentions usually exceed actual purchases, and reported brand use can reflect familiarity as well as behaviour. Where such benchmarks are available, comparing them with survey results helps calibrate forecasts and shows which questions can be trusted.
Calibration methods
When a benchmark is available, several approaches can bring survey estimates closer to it.
Weighting to benchmarks. If the benchmark is a population total, such as the number of people who voted, the survey can be weighted so that its estimate matches. Calibration estimation adjusts weights so that weighted totals equal known population values (Deville & Särndal, 1992). This removes bias in the calibrated variable and may reduce it in related variables, but only if the cause of the gap is nonresponse rather than misreporting.
Correction factors. If validation studies show that a measure is consistently over- or under-reported, a correction factor can be applied. For example, self-reported height and weight can be adjusted using equations estimated from studies in which people were both asked and measured (Connor Gorber et al., 2007).
Measurement error models. Where a validation subsample is available, statistical models can estimate the relationship between self-reports and true values and use it to correct analyses for the full sample. Regression calibration is one widely used method (Carroll et al., 2006).
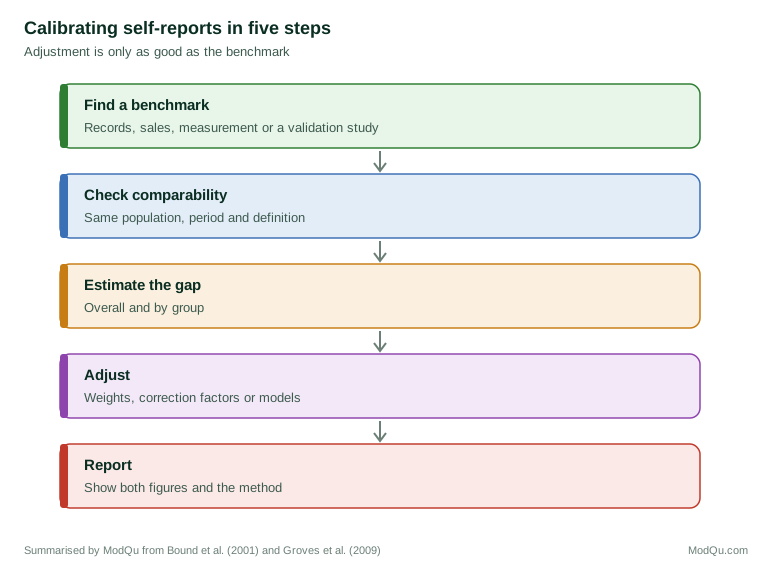
Figure 2 summarises the steps.
Cautions
Benchmarks are not always correct. Records contain errors, sales data include purchases by visitors and stock not consumed, and measurement devices have limitations of their own. The population covered by the benchmark may differ from the survey population, for example by including people living in institutions. Before adjusting, researchers should check that the benchmark and the survey measure the same thing for the same population and period (Groves et al., 2009).
Calibration also corrects only what the benchmark covers. Weighting a survey to match total alcohol sales does not reveal which groups under-report most, and a correction factor estimated in one population may not apply in another. Adjusted estimates should therefore be reported alongside unadjusted ones, with a clear description of the method.
Improving self-reports in the first place
Calibration is a remedy after the fact. Better question design reduces the need for it. Self-administered modes reduce social desirability bias (Kreuter et al., 2008). Questions that make it easy to admit not voting, for example by offering several face-saving response options, reduce over-reporting (Belli et al., 1999). Shorter reference periods and memory aids improve the recall of events. For frequent behaviours, asking about a specific recent day or week, rather than a typical one, reduces reliance on rough estimation. Where possible, surveys can also ask respondents to consult their own records, such as payslips or bank statements, before answering questions about income.
An example
A public health survey estimates that 62 per cent of adults meet physical activity guidelines. A validation substudy, in which a random subsample wears accelerometers for a week, finds that only about two-thirds of those reporting sufficient activity meet the guideline when measured. The survey team applies a correction model estimated from the substudy, which reduces the estimate to 44 per cent, and publishes both figures with an explanation (illustrative example).
Conclusion
Comparing self-reports with objective benchmarks shows where survey measures are accurate and where they are not. The gaps vary by topic, from small errors in height to large shortfalls in reported alcohol consumption. Weighting, correction factors and measurement error models can bring estimates closer to benchmarks, but they depend on benchmarks that are themselves accurate and comparable. Used with care and reported openly, calibration makes self-reported survey data a more reliable basis for knowledge.
References
Ansolabehere, S., & Hersh, E. (2012). Validation: What big data reveal about survey misreporting and the real electorate. Political Analysis, 20(4), 437–459. https://doi.org/10.1093/pan/mps023
Belli, R. F., Traugott, M. W., Young, M., & McGonagle, K. A. (1999). Reducing vote overreporting in surveys: Social desirability, memory failure, and source monitoring. Public Opinion Quarterly, 63(1), 90–108. https://doi.org/10.1086/297704
Bernstein, R., Chadha, A., & Montjoy, R. (2001). Overreporting voting: Why it happens and why it matters. Public Opinion Quarterly, 65(1), 22–44. https://doi.org/10.1086/320036
Bound, J., Brown, C., & Mathiowetz, N. (2001). Measurement error in survey data. In J. J. Heckman & E. Leamer (Eds.), Handbook of econometrics (Vol. 5, pp. 3705–3843). Elsevier. https://doi.org/10.1016/S1573-4412(01)05012-7
Carroll, R. J., Ruppert, D., Stefanski, L. A., & Crainiceanu, C. M. (2006). Measurement error in nonlinear models: A modern perspective (2nd ed.). Chapman & Hall/CRC. https://doi.org/10.1201/9781420010138
Connor Gorber, S., Tremblay, M., Moher, D., & Gorber, B. (2007). A comparison of direct vs. self-report measures for assessing height, weight and body mass index: A systematic review. Obesity Reviews, 8(4), 307–326. https://doi.org/10.1111/j.1467-789X.2007.00347.x
Deville, J.-C., & Särndal, C.-E. (1992). Calibration estimators in survey sampling. Journal of the American Statistical Association, 87(418), 376–382. https://doi.org/10.1080/01621459.1992.10475217
Groves, R. M., Fowler, F. J., Jr., Couper, M. P., Lepkowski, J. M., Singer, E., & Tourangeau, R. (2009). Survey methodology (2nd ed.). Wiley.
Kreuter, F., Presser, S., & Tourangeau, R. (2008). Social desirability bias in CATI, IVR, and web surveys: The effects of mode and question sensitivity. Public Opinion Quarterly, 72(5), 847–865. https://doi.org/10.1093/poq/nfn063
Meyer, B. D., Mok, W. K. C., & Sullivan, J. X. (2015). Household surveys in crisis. Journal of Economic Perspectives, 29(4), 199–226. https://doi.org/10.1257/jep.29.4.199
Moore, J. C., Stinson, L. L., & Welniak, E. J., Jr. (2000). Income measurement error in surveys: A review. Journal of Official Statistics, 16(4), 331–361.
Prince, S. A., Adamo, K. B., Hamel, M. E., Hardt, J., Connor Gorber, S., & Tremblay, M. (2008). A comparison of direct versus self-report measures for assessing physical activity in adults: A systematic review. International Journal of Behavioral Nutrition and Physical Activity, 5, Article 56. https://doi.org/10.1186/1479-5868-5-56
Sakshaug, J. W., & Kreuter, F. (2012). Assessing the magnitude of non-consent biases in linked survey and administrative data. Survey Research Methods, 6(2), 113–122. https://doi.org/10.18148/srm/2012.v6i2.5094
Silver, B. D., Anderson, B. A., & Abramson, P. R. (1986). Who overreports voting? American Political Science Review, 80(2), 613–624. https://doi.org/10.2307/1958277
Stockwell, T., Donath, S., Cooper-Stanbury, M., Chikritzhs, T., Catalano, P., & Mateo, C. (2004). Under-reporting of alcohol consumption in household surveys: A comparison of quantity–frequency, graduated–frequency and recent recall. Addiction, 99(8), 1024–1033. https://doi.org/10.1111/j.1360-0443.2004.00815.x
Tourangeau, R., & Yan, T. (2007). Sensitive questions in surveys. Psychological Bulletin, 133(5), 859–883. https://doi.org/10.1037/0033-2909.133.5.859