
Statistics · Inference
The ASA Statement on P-Values and the Move Beyond Significance
What the American Statistical Association said about p-values in 2016, why the debate went further in 2019, and how business and survey researchers can report evidence without relying on "significant".
In March 2016 the American Statistical Association (ASA) did something it had never done before: it issued a formal statement on a specific matter of statistical practice. The subject was the p-value, the most widely reported number in applied research. The statement set out six principles about what p-values can and cannot tell us (Wasserstein & Lazar, 2016). Three years later, a special issue of The American Statistician went further and urged researchers to stop using the phrase "statistically significant" altogether (Wasserstein et al., 2019).
These events matter well beyond academic journals. Market research reports, customer dashboards and A/B testing tools still sort results into "significant" and "not significant", often with coloured arrows or asterisks. This article explains how the debate arose, what the ASA statement actually says, what the proposals for moving beyond significance involve, and what all of this means for anyone who produces or reads business evidence.
How the 0.05 habit formed
The idea of checking whether data are surprising under a chance model is old, but its modern form comes from Ronald Fisher. In Statistical Methods for Research Workers, Fisher (1925) presented tables of test statistics and suggested that a probability of 1 in 20 was a convenient point for judging whether a deviation deserved attention. For Fisher, a small p-value was a signal to look more closely, to be weighed alongside other knowledge, not a final verdict.
Jerzy Neyman and Egon Pearson developed a different framework. Neyman and Pearson (1933) treated testing as a decision rule: choose an error rate α in advance, choose the most powerful test, and act as if the null hypothesis is false whenever the test statistic falls in the rejection region. Their approach controls long-run error rates across many decisions but says nothing about the strength of evidence in any single study.
Textbooks and journals later merged the two ideas into a hybrid that neither camp endorsed. Gigerenzer (2004) called this hybrid the "null ritual": set up a null hypothesis of no difference, use 5% as the threshold, and report the result as significant or not, without specifying an alternative hypothesis or considering power. Goodman (1999) described the resulting "p-value fallacy", the belief that one number can serve both as a long-run error rate and as a measure of evidence for a particular result.
Criticism was persistent. Cohen (1994), in a paper titled "The earth is round (p < .05)", argued that significance testing had encouraged researchers to confuse the probability of the data given the null hypothesis with the probability of the null hypothesis given the data. Yet the 0.05 threshold became more entrenched, not less, because it offered a simple rule for publication, regulation and decision-making.
The replication crisis as a trigger
What changed in the 2010s was evidence that the habit was doing real damage. Simmons et al. (2011) showed that flexible analysis choices could make almost any hypothesis appear significant. A large collaborative project, an early landmark of the open science movement, then tried to replicate 100 published psychology experiments: 97% of the original studies had reported significant results, but only 36% of the replications did (Open Science Collaboration, 2015). Similar concerns arose in medicine, economics and other fields.
Two responses brought the issue into public view. Nuzzo (2014), writing in Nature, explained to a broad audience why p-values are less reliable than many researchers assume. And in 2015 the journal Basic and Applied Social Psychology banned null hypothesis significance testing from its pages entirely (Trafimow & Marks, 2015). Many statisticians thought the ban went too far, but it signalled that the problem could no longer be left to methodological journals. The ASA board asked a group of experts to prepare a statement, which was developed over several months of discussion and published with a set of commentaries.
The six principles of the 2016 statement
The statement defines a p-value informally as "the probability under a specified statistical model that a statistical summary of the data (e.g., the sample mean difference between two compared groups) would be equal to or more extreme than its observed value" (Wasserstein & Lazar, 2016, p. 131). It then sets out six principles.
1. P-values can indicate how incompatible the data are with a specified statistical model
The smaller the p-value, the greater the incompatibility between the data and the null model, provided the assumptions behind the calculation hold. This is what a p-value is for, and the statement does not dispute its usefulness for this purpose.
2. P-values do not measure the probability that the hypothesis is true, or the probability that the data were produced by chance alone
A p-value of 0.03 does not mean a 3% chance that a new pack design makes no difference. The p-value is calculated assuming the null hypothesis is true, so it cannot also be the probability of that hypothesis. Greenland et al. (2016) catalogue this and many related misreadings.
3. Conclusions and business or policy decisions should not be based only on whether a p-value passes a specific threshold
The statement explicitly mentions business decisions. A launch decision should rest on the size of the expected gain, its uncertainty, costs, risks and prior knowledge, not on whether p happens to fall just below 0.05. Treating 0.049 and 0.051 as different kinds of result is a practice McShane and Gal (2017) found to be common even among trained researchers.
4. Proper inference requires full reporting and transparency
P-values lose their meaning when analysts report only the tests that "worked". Readers need to know how many comparisons were made, which analyses were planned and how data were selected. This principle links directly to the problem of multiple comparisons and to the flexible analysis described by Simmons et al. (2011).
5. A p-value, or statistical significance, does not measure the size of an effect or the importance of a result
With a large enough sample, trivially small differences become highly significant, while a small study can miss an important effect. Figure 1 shows three hypothetical tests of a new offer that make this point.
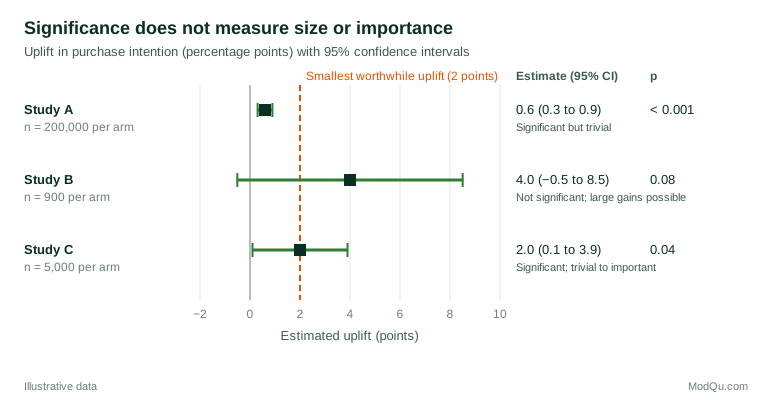
Study A is the most "significant", yet its whole interval lies below the smallest uplift worth acting on. Study B is "not significant", yet it is compatible with gains well above that level and needs more data, not dismissal. Study C is significant, but its interval runs from almost nothing to nearly double the worthwhile level.
6. By itself, a p-value does not provide a good measure of evidence regarding a model or hypothesis
A p-value near 0.05 is weaker evidence than many people assume. Using bounds on Bayesian measures of evidence, Sellke et al. (2001) showed that when a real effect and no effect are equally plausible beforehand, a p-value of 0.05 leaves at least about a 29% probability that there is no effect. The statement recommends supplementing p-values with other approaches, such as confidence intervals, Bayesian methods, likelihood ratios and decision-theoretic modelling.
What the statement did not say
The 2016 statement did not ban p-values, did not propose a new threshold and did not tell researchers which alternative to use. It was deliberately limited to points on which a broad range of statisticians could agree. Its message was that p-values are a valid tool that is widely misused, and that good practice requires context, transparency and judgement.
2019: "Moving to a world beyond p < 0.05"
In 2017 the ASA held a symposium on statistical inference, and in 2019 The American Statistician published a special issue of 43 papers on what should come next. The introductory editorial (Wasserstein et al., 2019) went further than the 2016 statement. Its authors concluded that the term "statistically significant" should be abandoned, along with variants such as "significantly different" and asterisks in tables. They summarised their advice with the acronym ATOM: accept uncertainty, and be thoughtful, open and modest.
At the same time, Amrhein et al. (2019) published a comment in Nature calling for an end to dichotomous significance claims; it attracted more than 800 signatories. McShane et al. (2019) argued that statistical significance should be abandoned as a screening rule for publication and decisions, with p-values treated as one continuous piece of evidence among others, such as prior evidence, plausibility of mechanism, study design and data quality.
The main proposals
The special issue and the wider debate offered several routes forward, which are not mutually exclusive.
- Report estimates and intervals. Cumming (2014) argued for a "new statistics" built on effect sizes, confidence intervals and meta-analysis. The focus moves from whether there is an effect to how large it is and how precisely it is known.
- Treat p-values as continuous. A p-value of 0.06 and one of 0.04 carry similar information. Reporting exact values without labels lets readers weigh the evidence themselves.
- Use compatibility language. Greenland (2019) and Rafi and Greenland (2020) suggest describing intervals as "compatibility intervals", showing the range of effects most compatible with the data under the model, rather than ranges in which we can be "confident".
- Convert p-values into surprise. The S-value, or Shannon information, is S = −log2(p). It measures how surprising the result is in bits, comparable to tossing a fair coin and seeing all heads (Greenland, 2019).
- Lower the threshold. A group of researchers proposed moving the default threshold for new discoveries from 0.05 to 0.005. Ioannidis (2018) argued that this would reduce false positives as a temporary measure, while acknowledging that it does not fix the deeper problems of dichotomous thinking.
- Use Bayesian evidence. Bayes factors compare how well two hypotheses predict the observed data (Kass & Raftery, 1995), and full Bayesian analysis gives probabilities for effect sizes directly, at the cost of specifying prior assumptions.
- Test for practical equivalence. When the question is whether a change is too small to matter, equivalence tests ask whether the effect lies within a pre-specified band of practical irrelevance (Lakens, 2017).
The S-value scale gives a useful feel for what common p-values mean.
| p-value | S-value (bits) | Roughly as surprising as |
|---|---|---|
| 0.50 | 1.0 | One head from one toss of a fair coin |
| 0.25 | 2.0 | Two heads in a row |
| 0.05 | 4.3 | About four heads in a row |
| 0.01 | 6.6 | About seven heads in a row |
| 0.005 | 7.6 | About eight heads in a row |
| 0.001 | 10.0 | Ten heads in a row |
Seen this way, p = 0.05 is mildly surprising, not decisive.
Thinking in compatibility curves
Instead of testing one null hypothesis, an analyst can compute the p-value for every possible effect size. The result is a compatibility curve, also called a p-value function (Figure 2). Its peak is the point estimate; where it crosses 0.05 are the limits of the 95% interval.
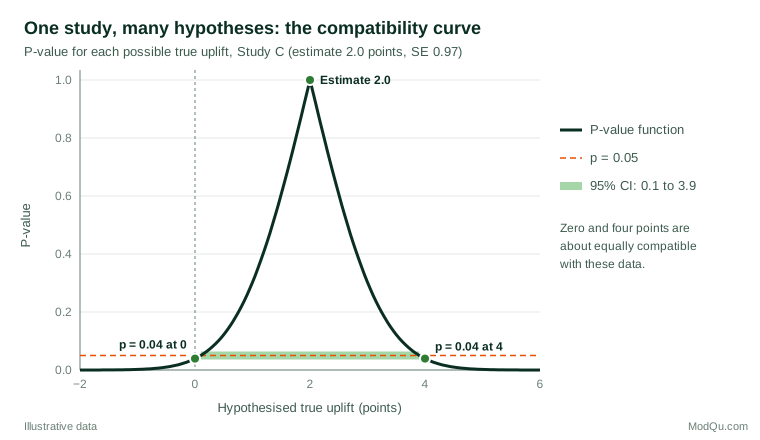
The curve makes clear that the data are just as incompatible with an uplift of four points as with an uplift of zero. Reporting only "significant at the 5% level" hides this symmetry and invites readers to treat 2.0 points as established.
The pushback: p-values still have a place
Not all statisticians agreed with abandoning significance. Critics argued that thresholds are needed wherever decisions must be made consistently, as in quality control, regulatory approval and clinical trials, and that removing them could make it easier, not harder, to overstate weak results. Because the 2019 editorial was sometimes read as official ASA policy, the ASA president appointed a task force to clarify the position. Its statement (Benjamini et al., 2021) affirmed that p-values and significance tests, properly applied and interpreted, increase the rigour of conclusions and should not be abandoned, while stressing that they should be accompanied by estimates, measures of uncertainty and sound study design.
The two positions are closer than they first appear. Both reject mechanical use of 0.05 as a dividing line between truth and falsehood. Both call for estimates, intervals and transparency. They differ mainly on whether a pre-set threshold remains useful as one input into a decision. Greenland (2019) noted that valid p-values behave exactly as they should; the problems lie in how they are interpreted and in the selective reporting that surrounds them.
What it means for business and survey research
Commercial research faces the same pressures that produced the replication crisis: many comparisons, flexible analyses, small subgroups and a strong appetite for clear answers. The practical lessons are straightforward.
- Lead with the estimate. Write "purchase intention was 2.0 points higher (95% interval 0.1 to 3.9)" rather than "the new design performed significantly better". Decision-makers need magnitude and uncertainty.
- Define what matters before analysis. Agree the smallest effect worth acting on, as in Figure 1, so that results can be judged against business value rather than an arbitrary threshold.
- Report exact p-values, not stars. If significance flags are required by a client or a tool, explain what they mean and what they do not.
- Do not equate "not significant" with "no difference". A non-significant result in a small sample is often compatible with both no effect and an important one. Gelman and Stern (2006) also warn that the difference between a significant and a non-significant result is not itself necessarily significant.
- Disclose the number of comparisons. A tracker that tests twenty attributes will produce a "significant" movement by chance most quarters.
- Bring in prior knowledge. A surprising result that contradicts years of tracking data needs stronger evidence than one that confirms a well-understood pattern.
- Plan for precision. Choose sample sizes so that intervals are narrow enough to support the decision, not merely so that a test has adequate power.
Common mistakes
- Reading the 2016 statement as a ban. It criticised misuse, not the p-value itself.
- Replacing one ritual with another. Swapping 0.05 for 0.005, or for a Bayes factor of 3, without thinking about context repeats the original mistake.
- Reporting intervals but reading them as tests. Checking only whether a confidence interval excludes zero discards the information the interval contains.
- Treating "trend towards significance" as a finding. Phrases such as "marginally significant" signal a result that the analyst wishes were stronger.
- Ignoring model assumptions. Every p-value depends on a model of how the data arose, including random sampling, independence and correct weighting. If those assumptions are wrong, the p-value is wrong too.
Key takeaways
The ASA statement did not abolish the p-value. It reminded researchers that a p-value measures only how compatible the data are with one specified model, and that it says nothing on its own about truth, size or importance. The later move beyond significance asks analysts to drop the binary label, report effect sizes with intervals, disclose every comparison and combine statistical results with judgement and prior knowledge. For business audiences, the best practice is simple: say how big the effect is, how uncertain it is, and how it bears on the decision at hand.
References
Amrhein, V., Greenland, S., & McShane, B. (2019). Scientists rise up against statistical significance. Nature, 567(7748), 305–307. https://doi.org/10.1038/d41586-019-00857-9
Benjamini, Y., De Veaux, R. D., Efron, B., Evans, S., Glickman, M. E., Graubard, B. I., He, X., Meng, X.-L., Reid, N., Stigler, S. M., Vardeman, S. B., Wikle, C. K., Wright, T., Young, L. J., & Kafadar, K. (2021). The ASA president's task force statement on statistical significance and replicability. The Annals of Applied Statistics, 15(3), 1084–1085. https://doi.org/10.1214/21-AOAS1501
Cohen, J. (1994). The earth is round (p < .05). American Psychologist, 49(12), 997–1003. https://doi.org/10.1037/0003-066X.49.12.997
Cumming, G. (2014). The new statistics: Why and how. Psychological Science, 25(1), 7–29. https://doi.org/10.1177/0956797613504966
Fisher, R. A. (1925). Statistical methods for research workers. Oliver and Boyd.
Gelman, A., & Stern, H. S. (2006). The difference between "significant" and "not significant" is not itself statistically significant. The American Statistician, 60(4), 328–331. https://doi.org/10.1198/000313006X152649
Gigerenzer, G. (2004). Mindless statistics. The Journal of Socio-Economics, 33(5), 587–606. https://doi.org/10.1016/j.socec.2004.09.033
Goodman, S. N. (1999). Toward evidence-based medical statistics. 1: The P value fallacy. Annals of Internal Medicine, 130(12), 995–1004. https://doi.org/10.7326/0003-4819-130-12-199906150-00008
Greenland, S. (2019). Valid p-values behave exactly as they should: Some misleading criticisms of p-values and their resolution with s-values. The American Statistician, 73(sup1), 106–114. https://doi.org/10.1080/00031305.2018.1529625
Greenland, S., Senn, S. J., Rothman, K. J., Carlin, J. B., Poole, C., Goodman, S. N., & Altman, D. G. (2016). Statistical tests, P values, confidence intervals, and power: A guide to misinterpretations. European Journal of Epidemiology, 31(4), 337–350. https://doi.org/10.1007/s10654-016-0149-3
Ioannidis, J. P. A. (2018). The proposal to lower P value thresholds to .005. JAMA, 319(14), 1429–1430. https://doi.org/10.1001/jama.2018.1536
Kass, R. E., & Raftery, A. E. (1995). Bayes factors. Journal of the American Statistical Association, 90(430), 773–795. https://doi.org/10.1080/01621459.1995.10476572
Lakens, D. (2017). Equivalence tests: A practical primer for t tests, correlations, and meta-analyses. Social Psychological and Personality Science, 8(4), 355–362. https://doi.org/10.1177/1948550617697177
McShane, B. B., & Gal, D. (2017). Statistical significance and the dichotomization of evidence. Journal of the American Statistical Association, 112(519), 885–895. https://doi.org/10.1080/01621459.2017.1289846
McShane, B. B., Gal, D., Gelman, A., Robert, C., & Tackett, J. L. (2019). Abandon statistical significance. The American Statistician, 73(sup1), 235–245. https://doi.org/10.1080/00031305.2018.1527253
Neyman, J., & Pearson, E. S. (1933). IX. On the problem of the most efficient tests of statistical hypotheses. Philosophical Transactions of the Royal Society of London. Series A, 231(694–706), 289–337. https://doi.org/10.1098/rsta.1933.0009
Nuzzo, R. (2014). Scientific method: Statistical errors. Nature, 506(7487), 150–152. https://doi.org/10.1038/506150a
Open Science Collaboration. (2015). Estimating the reproducibility of psychological science. Science, 349(6251), Article aac4716. https://doi.org/10.1126/science.aac4716
Rafi, Z., & Greenland, S. (2020). Semantic and cognitive tools to aid statistical science: Replace confidence and significance by compatibility and surprise. BMC Medical Research Methodology, 20, Article 244. https://doi.org/10.1186/s12874-020-01105-9
Sellke, T., Bayarri, M. J., & Berger, J. O. (2001). Calibration of p values for testing precise null hypotheses. The American Statistician, 55(1), 62–71. https://doi.org/10.1198/000313001300339950
Simmons, J. P., Nelson, L. D., & Simonsohn, U. (2011). False-positive psychology: Undisclosed flexibility in data collection and analysis allows presenting anything as significant. Psychological Science, 22(11), 1359–1366. https://doi.org/10.1177/0956797611417632
Trafimow, D., & Marks, M. (2015). Editorial. Basic and Applied Social Psychology, 37(1), 1–2. https://doi.org/10.1080/01973533.2015.1012991
Wasserstein, R. L., & Lazar, N. A. (2016). The ASA statement on p-values: Context, process, and purpose. The American Statistician, 70(2), 129–133. https://doi.org/10.1080/00031305.2016.1154108
Wasserstein, R. L., Schirm, A. L., & Lazar, N. A. (2019). Moving to a world beyond "p < 0.05". The American Statistician, 73(sup1), 1–19. https://doi.org/10.1080/00031305.2019.1583913