
Statistics · Inference
Statistical Significance Versus Practical Significance
A result can be statistically significant yet too small to matter, or important yet not significant. This article explains the difference and shows how to judge findings by size, uncertainty and business value.
"The difference is significant" is one of the most quoted and least understood phrases in research reporting. In everyday language, significant means important. In statistics it means something much narrower: that the observed result would be unusual if there were no real effect. The two meanings often coincide, but they do not have to. A difference can be statistically significant and commercially worthless, and a difference that would be worth a great deal can fail to reach significance.
Kirk (1996) called practical significance "a concept whose time has come", arguing that researchers were reporting whether effects existed while neglecting whether they mattered. Three decades later, the same confusion appears in survey reports, A/B test dashboards and board papers. This article separates the two ideas, shows why they diverge, and offers a practical way to judge findings by their size, their uncertainty and their consequences.
What statistical significance means
A significance test starts from a null hypothesis, usually that there is no difference between groups or no relationship between variables. The p-value is the probability of obtaining a result at least as extreme as the one observed if that null hypothesis, and all the other assumptions of the model, were true. When the p-value falls below a chosen threshold, conventionally 0.05 following Fisher (1925), the result is called statistically significant.
The American Statistical Association's statement on p-values sets out what this does and does not imply (Wasserstein & Lazar, 2016). Among its six principles: a p-value does not measure the probability that the hypothesis is true, and it does not measure the size of an effect or the importance of a result. Greenland et al. (2016) list many further misreadings, including the belief that a non-significant result shows there is no effect.
The key point for this article is structural. Most test statistics take the form
test statistic = observed effect ÷ standard error
and the standard error shrinks in proportion to 1 ÷ √n. The test statistic therefore grows with the size of the effect and with the size of the sample. A significance test cannot tell these two sources apart.
What practical significance means
Practical significance asks whether an effect is large enough to matter for a decision. There is no single formula for it, because the answer depends on context: the costs of acting, the value of the outcome, and the alternatives available. Thompson (2002) distinguished three kinds of significance: statistical significance (is the result unlikely under the null?), practical significance (is the effect large enough to be useful?), and clinical significance (does it change outcomes for the people being treated?). Only the first is answered by a p-value.
Medicine formalised the idea through the minimal clinically important difference: the smallest change in a measured outcome that patients perceive as beneficial and that would justify a change in treatment (Jaeschke et al., 1989). Kraemer and Kupfer (2006) argue that effect sizes should be chosen and reported so that clinicians can judge exactly this kind of importance. Business has natural equivalents: the break-even lift that pays for a redesign, the change in satisfaction that historically moves retention, or the shift in awareness that justifies extending a campaign.
Practical significance is judged on the effect size, ideally in the original units, together with its confidence interval (Cumming, 2014; Ellis, 2010). Cohen's (1988) benchmarks for small, medium and large effects can help when nothing else is known, but they are not a substitute for a decision-relevant threshold.
Why the two diverge: sample size
Large samples make tiny effects significant
Consider an illustrative online experiment. The current checkout page converts 10.0% of visitors; a redesigned page converts 10.3%. The lift is 0.3 percentage points, a 3% relative improvement. Is it significant?
That depends entirely on how many visitors were tested. With 10,000 visitors per version, a two-proportion test gives p ≈ 0.48. With 80,000 per version, p ≈ 0.047. With 200,000 per version, p ≈ 0.002, and with 500,000 per version p is below one in a million. The effect is exactly the same in every case; only the evidence that it is not zero changes.
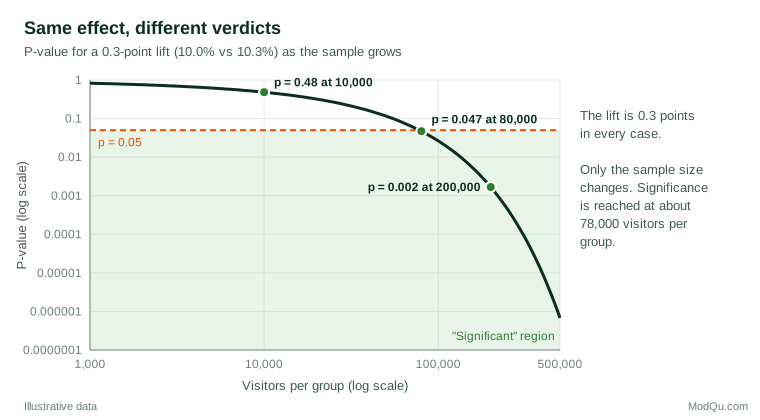
Lin et al. (2013) describe this as the p-value problem of large samples: in data sets with hundreds of thousands of records, almost every comparison becomes significant, so significance on its own stops being informative. Meehl (1967) made a related point decades earlier. In observational research, the null hypothesis of exactly zero difference is almost never literally true, so with enough precision a significant result is close to guaranteed and says little about the theory being tested.
Suppose the retailer had decided in advance that any lift below 0.5 percentage points would not repay the cost of the redesign. With 200,000 visitors per version, the 95% confidence interval for the lift runs from about 0.11 to 0.49 points. The result is statistically significant, yet the entire interval lies below the threshold of practical value. The right conclusion is that the redesign almost certainly helps a little, and almost certainly not enough.
Small samples hide important effects
The reverse problem is common in surveys of hard-to-reach groups, business-to-business studies and pilot tests. Suppose a pilot loyalty offer appears to raise repeat purchase by 8 points, but the sample is small and p = 0.20. The effect, if real, would be very valuable; the data are simply too imprecise to rule out zero. Treating this as "no effect" is a classic error. Altman and Bland (1995) put it in a phrase: absence of evidence is not evidence of absence.
Small samples create a further trap. When a small study does reach significance, the estimated effect is likely to be exaggerated, because only the luckiest overestimates clear the threshold. Gelman and Carlin (2014) call this a Type M (magnitude) error and show that, in low-powered studies, significant estimates can overstate the true effect several times over and occasionally get its sign wrong (a Type S error). A striking, significant result from a small sample deserves more caution, not less.
A better framework: intervals against a threshold of importance
The way out is to stop asking a single yes/no question and to ask two: how large is the effect, and how precisely is it known? A confidence interval answers both at once. Comparing it with zero shows statistical significance; comparing it with a smallest effect of interest shows practical significance (Cumming, 2014; Lakens et al., 2018).
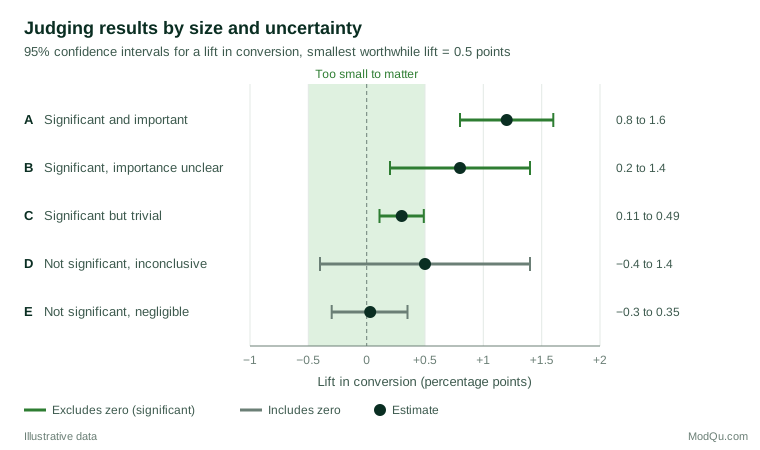
Figure 2 shows the five situations an analyst can meet. They are summarised below.
| Scenario | Interval excludes zero? | Interval relative to the threshold | Sensible conclusion |
|---|---|---|---|
| A | Yes | Entirely above | Real and worthwhile: act |
| B | Yes | Straddles it | Real, size uncertain: weigh costs or collect more data |
| C | Yes | Entirely inside the negligible band | Real but too small to matter |
| D | No | Spans negligible and important values | Inconclusive: the study cannot tell |
| E | No | Entirely inside the negligible band | Any effect is too small to matter |
Scenarios D and E both have non-significant p-values, yet they mean very different things. D is uninformative; E is positive evidence that the effect is negligible. Equivalence testing formalises scenario E. The two one-sided tests procedure checks whether the effect is significantly above the lower bound and significantly below the upper bound of the negligible range, which allows an analyst to conclude that two versions perform equivalently for practical purposes (Lakens, 2017). This is useful for questions such as whether a shorter questionnaire produces the same answers as the longer one, or whether a cheaper supplier's product is rated as highly.
Setting the threshold of practical importance
The framework only works if the threshold is set honestly, and preferably before the data are seen. Useful sources include:
- Economics. The lift needed to pay back implementation, media or production costs. Kohavi et al. (2020) recommend that online experiments define a practical significance boundary alongside the statistical one, so that launch decisions reflect both.
- Historical variation. The normal wave-to-wave movement in a tracking study, or the spread of results from past experiments in the same category.
- Perceptibility. The smallest change customers would notice, the business analogue of the minimal clinically important difference (Jaeschke et al., 1989).
- Measurement precision. Differences smaller than the scale's reliability allows cannot be interpreted meaningfully.
- Strategic weight. A small effect on a high-volume, low-cost behaviour can be worth more than a large effect on a rare one. Ellis (2010) stresses that small effects can matter a great deal when they accumulate across many people or many occasions.
Write the threshold into the research plan. Choosing it after seeing the results invites the same flexible reasoning that produces false findings.
Survey and market research examples
- Brand trackers. With 2,000 interviews a wave, a 3-point rise in awareness may be significant. Whether it matters depends on whether 3 points is outside normal fluctuation and whether it is large enough to affect sales or media plans.
- Segment comparisons. In a large customer database, almost every segment differs significantly from every other on almost every attribute. Rank differences by size and relevance, not by p-value.
- Concept and pack tests. Small monadic cells often produce large but non-significant differences. Report the estimated difference and interval, and say clearly whether the test was powered to detect the smallest difference that would change the decision.
- Weighted samples. Survey weights and clustering increase standard errors. A difference that looks significant with naive formulas may not be once the design effect is taken into account, and the confidence interval, not just the p-value, should reflect the design.
The wider debate
Concern about over-reliance on significance has a long history. Cohen (1994) argued that null hypothesis testing had become a ritual that answered questions researchers did not actually have. Ziliak and McCloskey (2008) documented how economists and others routinely confused statistical significance with economic importance, a confusion they summarised as ignoring the "oomph" of an effect. Gelman and Stern (2006) showed a related fallacy: the difference between a "significant" and a "not significant" result is not itself necessarily significant, so comparing findings by their significance labels can be badly misleading.
In 2019 a special issue of The American Statistician went further, recommending that researchers stop using the phrase "statistically significant" altogether and instead report estimates, uncertainty and context (Wasserstein et al., 2019). In the same year, more than 800 signatories supported a call in Nature to retire statistical significance as a bright-line rule (Amrhein et al., 2019). Not every statistician agrees that thresholds should be abandoned, and pre-specified decision rules remain useful in controlled experiments. There is, however, broad agreement on the core message of this article: a significance label is never enough on its own.
Common mistakes
- Equating "significant" with "important". Always state the size of the effect in meaningful units before reporting its p-value.
- Equating "not significant" with "no effect". Report the interval; it may include values that would matter a great deal (Altman & Bland, 1995).
- Ignoring sample size when reading p-values. A p-value of 0.001 from a million records may reflect a trivial difference; a p-value of 0.08 from 60 interviews may reflect a large one.
- Trusting large effects from small samples. Significant results from underpowered studies tend to be exaggerated (Gelman & Carlin, 2014).
- Using generic benchmarks as thresholds. A "small" standardised effect can be very valuable, and a "medium" one can be irrelevant, depending on costs and stakes.
- Moving the goalposts. Setting the threshold of importance after seeing the data undermines the whole exercise.
- Comparing significance labels. "Significant for women but not for men" does not show that the effect differs by gender; test the difference directly (Gelman & Stern, 2006).
A practical checklist
Before presenting a finding to a client or a board, an analyst can work through five questions:
- What is the estimated effect, in units the audience understands?
- What is the confidence interval around it?
- What is the smallest effect that would change the decision, and was it set in advance?
- Where does the interval lie relative to zero and to that threshold?
- Was the study large enough to detect the smallest important effect, and is the estimate plausibly inflated?
Answering these questions turns a p-value from a verdict into one piece of evidence among several, which is the role the American Statistical Association intended for it (Wasserstein & Lazar, 2016).
Key takeaways
Statistical significance and practical significance answer different questions. The first asks whether an effect can be distinguished from zero; the second asks whether it is big enough to matter. Because significance depends on sample size as much as on effect size, large data sets make trivial effects significant and small studies leave important effects unproven. The remedy is to report the effect size with its confidence interval, to compare that interval with a pre-agreed threshold of practical importance, and to use equivalence tests when the aim is to show that a difference is negligible. Decisions should rest on how large an effect is likely to be and what it is worth, not on which side of 0.05 a p-value happens to fall.
References
Altman, D. G., & Bland, J. M. (1995). Absence of evidence is not evidence of absence. BMJ, 311(7003), 485. https://doi.org/10.1136/bmj.311.7003.485
Amrhein, V., Greenland, S., & McShane, B. (2019). Scientists rise up against statistical significance. Nature, 567(7748), 305–307. https://doi.org/10.1038/d41586-019-00857-9
Cohen, J. (1988). Statistical power analysis for the behavioral sciences (2nd ed.). Routledge. https://doi.org/10.4324/9780203771587
Cohen, J. (1994). The earth is round (p < .05). American Psychologist, 49(12), 997–1003. https://doi.org/10.1037/0003-066X.49.12.997
Cumming, G. (2014). The new statistics: Why and how. Psychological Science, 25(1), 7–29. https://doi.org/10.1177/0956797613504966
Ellis, P. D. (2010). The essential guide to effect sizes: Statistical power, meta-analysis, and the interpretation of research results. Cambridge University Press. https://doi.org/10.1017/CBO9780511761676
Fisher, R. A. (1925). Statistical methods for research workers. Oliver and Boyd.
Gelman, A., & Carlin, J. (2014). Beyond power calculations: Assessing Type S (sign) and Type M (magnitude) errors. Perspectives on Psychological Science, 9(6), 641–651. https://doi.org/10.1177/1745691614551642
Gelman, A., & Stern, H. S. (2006). The difference between "significant" and "not significant" is not itself statistically significant. The American Statistician, 60(4), 328–331. https://doi.org/10.1198/000313006X152649
Greenland, S., Senn, S. J., Rothman, K. J., Carlin, J. B., Poole, C., Goodman, S. N., & Altman, D. G. (2016). Statistical tests, P values, confidence intervals, and power: A guide to misinterpretations. European Journal of Epidemiology, 31(4), 337–350. https://doi.org/10.1007/s10654-016-0149-3
Jaeschke, R., Singer, J., & Guyatt, G. H. (1989). Measurement of health status: Ascertaining the minimal clinically important difference. Controlled Clinical Trials, 10(4), 407–415. https://doi.org/10.1016/0197-2456(89)90005-6
Kirk, R. E. (1996). Practical significance: A concept whose time has come. Educational and Psychological Measurement, 56(5), 746–759. https://doi.org/10.1177/0013164496056005002
Kohavi, R., Tang, D., & Xu, Y. (2020). Trustworthy online controlled experiments: A practical guide to A/B testing. Cambridge University Press. https://doi.org/10.1017/9781108653985
Kraemer, H. C., & Kupfer, D. J. (2006). Size of treatment effects and their importance to clinical research and practice. Biological Psychiatry, 59(11), 990–996. https://doi.org/10.1016/j.biopsych.2005.09.014
Lakens, D. (2017). Equivalence tests: A practical primer for t tests, correlations, and meta-analyses. Social Psychological and Personality Science, 8(4), 355–362. https://doi.org/10.1177/1948550617697177
Lakens, D., Scheel, A. M., & Isager, P. M. (2018). Equivalence testing for psychological research: A tutorial. Advances in Methods and Practices in Psychological Science, 1(2), 259–269. https://doi.org/10.1177/2515245918770963
Lin, M., Lucas, H. C., Jr., & Shmueli, G. (2013). Too big to fail: Large samples and the p-value problem. Information Systems Research, 24(4), 906–917. https://doi.org/10.1287/isre.2013.0480
Meehl, P. E. (1967). Theory-testing in psychology and physics: A methodological paradox. Philosophy of Science, 34(2), 103–115. https://doi.org/10.1086/288135
Thompson, B. (2002). "Statistical," "practical," and "clinical": How many kinds of significance do counselors need to consider? Journal of Counseling & Development, 80(1), 64–71. https://doi.org/10.1002/j.1556-6678.2002.tb00167.x
Wasserstein, R. L., & Lazar, N. A. (2016). The ASA statement on p-values: Context, process, and purpose. The American Statistician, 70(2), 129–133. https://doi.org/10.1080/00031305.2016.1154108
Wasserstein, R. L., Schirm, A. L., & Lazar, N. A. (2019). Moving to a world beyond "p < 0.05". The American Statistician, 73(Suppl. 1), 1–19. https://doi.org/10.1080/00031305.2019.1583913
Ziliak, S. T., & McCloskey, D. N. (2008). The cult of statistical significance: How the standard error costs us jobs, justice, and lives. University of Michigan Press. https://doi.org/10.3998/mpub.186351