
Statistics · Survey statistics
Reliability Statistics: Cronbach's Alpha and Alternatives
What Cronbach's alpha measures, why it is often misread, and when coefficient omega, test–retest correlations or intraclass correlations give a better answer for survey scales.
Multi-item scales are everywhere in survey research: brand trust measured with four statements, employee engagement with nine, customer effort with three. Before such a scale is used to compare segments or track change, analysts need to know whether it measures consistently. Reliability is the statistical answer to that question, and Cronbach's alpha is by far the most frequently reported reliability coefficient. It is also one of the most frequently misunderstood. This article explains what alpha does and does not tell you, and when other coefficients are a better choice.
What reliability means
Classical test theory treats every observed score as the sum of a true score and random error. Reliability is the share of the variance in observed scores that is due to true differences between people rather than to error:
reliability = σ2true ÷ σ2observed
A reliability of 0.80 means that 80% of the variation in scores reflects real differences and 20% reflects noise. Reliability matters for two practical reasons. Unreliable scores make groups look more similar than they are and weaken correlations with other variables, a problem Spearman (1904) identified when he proposed the correction for attenuation. And unreliable scores are unsuitable for decisions about individuals, such as flagging a customer as at risk.
Reliability cannot be observed directly, because true scores are unknown. It must be estimated, and there are several ways to do so, each answering a slightly different question:
- Internal consistency: do the items of a scale move together within a single administration?
- Test–retest reliability: do people get similar scores when measured twice, with no real change in between?
- Inter-rater reliability: do different coders or judges give the same rating to the same case?
Cronbach's alpha
Cronbach (1951) generalised an earlier formula for right-or-wrong test items (Kuder & Richardson, 1937) to items with any scoring, such as rating scales. Guttman (1945) had derived the same coefficient as one of a series of lower bounds to reliability. For a scale of k items, alpha compares the sum of the item variances with the variance of the total score:
α = (k ÷ (k − 1)) × (1 − Σ σ2i ÷ σ2total)
When items are strongly correlated, the total score varies much more than the items do individually, and alpha is high. When the items are unrelated, alpha is close to zero. For standardised items, alpha can be written in terms of the average inter-item correlation r̄:
αstd = k r̄ ÷ (1 + (k − 1) r̄)
This version of the formula is the same as the Spearman–Brown prophecy formula (Spearman, 1910; Brown, 1910), which predicts how reliability changes when a scale is lengthened with similar items.
What alpha does not tell you
Alpha depends on the number of items
The standardised formula shows that alpha rises with the number of items even when items are only weakly related. Cortina (1993) showed that a long scale can have an impressive alpha while its items share little in common. Figure 1 illustrates the point.
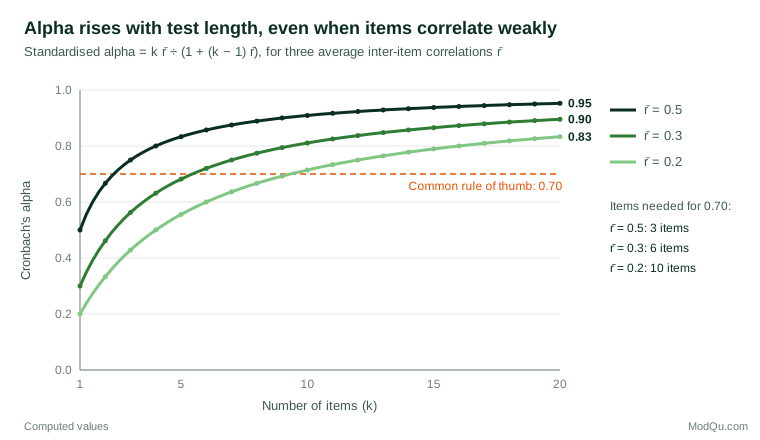
For a business audience, the lesson is that a scale with an alpha of 0.85 and twenty items may be less coherent than a four-item scale with an alpha of 0.78.
Alpha is not a measure of unidimensionality
A high alpha is often taken as evidence that all items measure one thing. It is not. Green et al. (1977) showed that alpha can be high for scales that measure several distinct factors, and Schmitt (1996) warned against using alpha to judge whether a scale is unidimensional. Dimensionality should be checked directly, with factor analysis, before reliability is calculated.
Alpha rests on strong assumptions
Alpha equals reliability only when every item measures the true score equally well, a condition known as tau-equivalence, and when item errors are uncorrelated. If items differ in how strongly they reflect the construct, which is almost always the case, alpha underestimates reliability. If errors are correlated, for example because several items share similar wording or appear together on one screen, alpha can overestimate it (McNeish, 2018; Sijtsma, 2009). Even Cronbach later wrote that he no longer regarded alpha as the best way to assess reliability and favoured a broader approach based on variance components (Cronbach & Shavelson, 2004).
Alternatives to alpha
Coefficient omega
The most widely recommended alternative is coefficient omega (McDonald, 1999). Omega is computed from a factor analysis of the items and allows each item to have its own loading, that is, its own strength of relationship with the construct. For a one-factor model with loadings λi and error variances θi:
ω = (Σ λi)2 ÷ ((Σ λi)2 + Σ θi)
When all loadings are equal, omega and alpha coincide. When they differ, omega is the more accurate estimate. Dunn et al. (2014) described alpha's continued dominance as a pervasive problem and recommended reporting omega with a confidence interval, and McNeish (2018) and Flora (2020) reached similar conclusions.
For scales with a general factor and several subfactors, two versions are useful. Omega total estimates the reliability of the total score from all common factors. Omega hierarchical estimates how much of the total score reflects the general factor alone, which shows whether a single total score is meaningful (Zinbarg et al., 2005; Revelle & Zinbarg, 2009).
Other internal consistency coefficients
Sijtsma (2009) argued for the greatest lower bound, which is the smallest reliability consistent with the observed covariances, while Revelle and Zinbarg (2009) preferred omega for most applications. For ordinal items with few response categories, versions of omega based on polychoric correlations, which treat the responses as cut-points on a continuous scale, can be more appropriate (Flora, 2020).
Test–retest and inter-rater reliability
Internal consistency is not the only kind of reliability. For a single-item measure, such as an overall satisfaction rating, internal consistency cannot be computed at all, and test–retest reliability, the correlation between two measurements of the same people a short time apart, is the natural alternative. When open-ended answers are coded by people, inter-rater reliability is the key question. Shrout and Fleiss (1979) described the family of intraclass correlation coefficients used for both purposes and showed that the right version depends on whether raters are fixed or random and whether absolute agreement or consistency matters.
A worked example
Consider a hypothetical four-item brand trust scale with standardised factor loadings of 0.9, 0.8, 0.6 and 0.4. The items are of unequal quality: the fourth is weak.
| Scale version | Cronbach's alpha | Coefficient omega |
|---|---|---|
| All four items | 0.76 | 0.78 |
| Weakest item removed | 0.81 | 0.82 |
Alpha slightly underestimates reliability because the loadings differ, and the gap would be larger with more unequal items. Removing the weak fourth item increases both coefficients, which suggests that the item adds more noise than signal. In practice, analysts should also consider content before dropping an item: if the fourth statement covers an aspect of trust that the others miss, keeping it may be worth a small loss of reliability.
The Spearman–Brown formula shows what lengthening the scale would achieve. Doubling the original four-item scale with eight comparable items would raise reliability from 0.76 to about 0.86, since 2 × 0.76 ÷ (1 + 0.76) ≈ 0.86.
How much reliability is enough?
The threshold of 0.70 is quoted so often that it has become a rule. Nunnally and Bernstein (1994) suggested that modest reliability can suffice in the early stages of research, but that values of around 0.90 or higher are needed when scores are used to make important decisions about individuals. Very high values are not always good news either: an alpha above about 0.95 may mean that items are near-duplicates that add length without adding information. A sensible standard depends on the purpose:
- Comparing group averages, as in most market research, can tolerate moderate reliability, because random error averages out across respondents.
- Classifying or scoring individuals, as in customer risk scores or employee assessments, needs high reliability.
- Tracking change over time needs reliable measures, because unreliability inflates apparent change for individuals.
Why reliability matters for analysis
Unreliable measures do not only add noise to individual scores; they also distort relationships between variables. Spearman (1904) showed that random error weakens observed correlations in a predictable way:
robserved = rtrue × √(relx × rely)
Suppose, hypothetically, that the true correlation between brand trust and purchase intention is 0.50, and the two scales have reliabilities of 0.70 and 0.80. The observed correlation would be only about 0.37. In a driver analysis, a less reliable attribute will therefore look less important than it really is, and the ranking of drivers can change simply because some attributes were measured with more items than others. Structural equation models, which estimate relationships between latent factors rather than observed scores, are one way to correct for this.
Reliability is also distinct from validity. A scale can be highly reliable and still measure the wrong thing, for example when every item reflects a general tendency to agree rather than the intended attitude. Reliability is a necessary condition for useful measurement, not a sufficient one.
Computing the coefficients
Most general statistical packages report alpha by default, often with an "alpha if item deleted" column. Omega requires a factor model and is available in R and in structural equation modelling software; Flora (2020) gives a step-by-step tutorial. Whatever the tool, record which version of omega was computed, how missing data were handled and whether the items were treated as continuous or ordinal, because these choices can change the result.
Practical guidance
- Check dimensionality first. Run a factor analysis and confirm that items form the intended factors before calculating reliability for each one.
- Report omega, ideally with a confidence interval, and alpha alongside it for comparability with earlier studies (Dunn et al., 2014).
- Report the number of items and the average inter-item correlation, so readers can judge whether a high coefficient reflects length or coherence (Cortina, 1993).
- Re-estimate reliability in each new sample. Reliability is a property of scores in a particular population, not a fixed property of the questionnaire.
- Use test–retest or intraclass correlations for single items and coded data, where internal consistency is not meaningful.
Common mistakes
- Treating alpha as proof of unidimensionality. It is not, as Green et al. (1977) demonstrated.
- Dropping items mechanically to push alpha over 0.70, without considering content coverage.
- Citing alpha from an earlier study rather than estimating it in the current data.
- Reverse-coding errors. Negatively worded items that have not been reversed produce low or even negative alpha.
- Ignoring correlated errors from similarly worded items, which can inflate alpha.
Key takeaways
Cronbach's alpha is a useful but limited summary of internal consistency. It rises with the number of items, does not establish unidimensionality and is accurate only under assumptions that rarely hold. Coefficient omega, based on a factor model, is a better default for survey scales, and omega hierarchical shows whether a total score is meaningful. Test–retest and intraclass correlations answer different reliability questions and should be used where they fit. Whatever coefficient is chosen, report it with the number of items, check dimensionality first and set the standard according to how the scores will be used.
References
Brown, W. (1910). Some experimental results in the correlation of mental abilities. British Journal of Psychology, 3(3), 296–322. https://doi.org/10.1111/j.2044-8295.1910.tb00207.x
Cortina, J. M. (1993). What is coefficient alpha? An examination of theory and applications. Journal of Applied Psychology, 78(1), 98–104. https://doi.org/10.1037/0021-9010.78.1.98
Cronbach, L. J. (1951). Coefficient alpha and the internal structure of tests. Psychometrika, 16(3), 297–334. https://doi.org/10.1007/BF02310555
Cronbach, L. J., & Shavelson, R. J. (2004). My current thoughts on coefficient alpha and successor procedures. Educational and Psychological Measurement, 64(3), 391–418. https://doi.org/10.1177/0013164404266386
Dunn, T. J., Baguley, T., & Brunsden, V. (2014). From alpha to omega: A practical solution to the pervasive problem of internal consistency estimation. British Journal of Psychology, 105(3), 399–412. https://doi.org/10.1111/bjop.12046
Flora, D. B. (2020). Your coefficient alpha is probably wrong, but which coefficient omega is right? A tutorial on using R to obtain better reliability estimates. Advances in Methods and Practices in Psychological Science, 3(4), 484–501. https://doi.org/10.1177/2515245920951747
Green, S. B., Lissitz, R. W., & Mulaik, S. A. (1977). Limitations of coefficient alpha as an index of test unidimensionality. Educational and Psychological Measurement, 37(4), 827–838. https://doi.org/10.1177/001316447703700403
Guttman, L. (1945). A basis for analyzing test-retest reliability. Psychometrika, 10(4), 255–282. https://doi.org/10.1007/BF02288892
Kuder, G. F., & Richardson, M. W. (1937). The theory of the estimation of test reliability. Psychometrika, 2(3), 151–160. https://doi.org/10.1007/BF02288391
McDonald, R. P. (1999). Test theory: A unified treatment. Lawrence Erlbaum Associates. https://doi.org/10.4324/9781410601087
McNeish, D. (2018). Thanks coefficient alpha, we'll take it from here. Psychological Methods, 23(3), 412–433. https://doi.org/10.1037/met0000144
Nunnally, J. C., & Bernstein, I. H. (1994). Psychometric theory (3rd ed.). McGraw-Hill.
Revelle, W., & Zinbarg, R. E. (2009). Coefficients alpha, beta, omega, and the glb: Comments on Sijtsma. Psychometrika, 74(1), 145–154. https://doi.org/10.1007/s11336-008-9102-z
Schmitt, N. (1996). Uses and abuses of coefficient alpha. Psychological Assessment, 8(4), 350–353. https://doi.org/10.1037/1040-3590.8.4.350
Shrout, P. E., & Fleiss, J. L. (1979). Intraclass correlations: Uses in assessing rater reliability. Psychological Bulletin, 86(2), 420–428. https://doi.org/10.1037/0033-2909.86.2.420
Sijtsma, K. (2009). On the use, the misuse, and the very limited usefulness of Cronbach's alpha. Psychometrika, 74(1), 107–120. https://doi.org/10.1007/s11336-008-9101-0
Spearman, C. (1904). The proof and measurement of association between two things. The American Journal of Psychology, 15(1), 72–101. https://doi.org/10.2307/1412159
Spearman, C. (1910). Correlation calculated from faulty data. British Journal of Psychology, 3(3), 271–295. https://doi.org/10.1111/j.2044-8295.1910.tb00206.x
Zinbarg, R. E., Revelle, W., Yovel, I., & Li, W. (2005). Cronbach's α, Revelle's β, and McDonald's ωH: Their relations with each other and two alternative conceptualizations of reliability. Psychometrika, 70(1), 123–133. https://doi.org/10.1007/s11336-003-0974-7