
Statistics · Inference
Multiple Comparisons and the Problem of False Discoveries
Why running many significance tests on one dataset produces false positives, how Bonferroni, Holm and false discovery rate methods control them, and when adjustment is and is not needed.
A survey report that compares ten customer segments on twenty attributes contains two hundred possible significance tests. Even if no real differences existed, about ten of them would be expected to come out "significant" at the 5% level. This is the multiple comparisons problem: the more questions we ask of the same data, the more likely some answers are flukes. It is one of the main reasons why published and commercial findings fail to replicate (Ioannidis, 2005).
Why false positives multiply
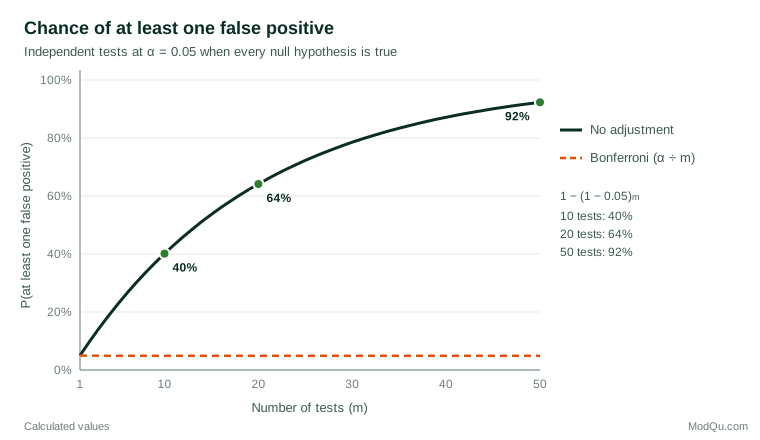
A single test at α = 0.05 accepts a 5% chance of a Type I error when the null hypothesis is true. With m independent tests of true null hypotheses, the probability of at least one false positive, called the familywise error rate (FWER), is:
FWER = 1 − (1 − α)m
With ten tests the chance is 40%; with twenty it is 64%; with fifty it is 92% (Figure 1). In practice tests in a survey are rarely independent, because the same respondents answer every question, but the broad lesson holds.
The problem is not only the tests that are reported. Simmons et al. (2011) showed that flexibility in analysis, such as choosing among outcomes, covariates or subgroups after seeing the data, can push the real false-positive rate far above the nominal 5%, even when each analysis looks reasonable on its own. Every comparison that could have been reported counts.
Two ways to define the error
Methods for multiple testing differ in what they control.
- Familywise error rate. The probability of making even one false discovery. Controlling it is appropriate when a single false claim is costly, such as a regulatory claim or a decision to relaunch a product.
- False discovery rate (FDR). The expected proportion of false discoveries among the results declared significant. Benjamini and Hochberg (1995) introduced it for settings with many tests, where some false leads are acceptable as long as most findings are real.
The main procedures
Bonferroni. Test each hypothesis at α ÷ m. With ten tests, each needs p ≤ 0.005. Dunn (1961) set out the method for confidence intervals on several means. It is simple and valid under any dependence between tests, but it becomes very conservative when m is large.
Holm. Order the p-values from smallest to largest and compare the k-th smallest with α ÷ (m − k + 1), stopping at the first that fails. Holm (1979) proved that this step-down method controls the FWER just as Bonferroni does, while rejecting at least as many hypotheses. There is no reason to prefer plain Bonferroni over Holm.
Benjamini–Hochberg. Order the p-values and find the largest k for which p(k) ≤ (k ÷ m) × q, where q is the target FDR; reject the k smallest. The procedure is valid for independent tests and for many forms of positive dependence, and Benjamini and Yekutieli (2001) give a more conservative version for arbitrary dependence. Storey and Tibshirani (2003) developed the related q-value, which reports for each test the smallest FDR at which it would be declared significant.
A worked example
Suppose a hypothetical brand tracker compares this quarter with last quarter on ten image attributes and obtains these p-values, sorted from smallest to largest.
| Rank | p-value | Holm threshold | BH threshold (q = 0.05) | Unadjusted | Bonferroni | Holm | BH |
|---|---|---|---|---|---|---|---|
| 1 | 0.001 | 0.0050 | 0.005 | Yes | Yes | Yes | Yes |
| 2 | 0.004 | 0.0056 | 0.010 | Yes | Yes | Yes | Yes |
| 3 | 0.009 | 0.0063 | 0.015 | Yes | No | No | Yes |
| 4 | 0.016 | 0.0071 | 0.020 | Yes | No | No | Yes |
| 5 | 0.022 | 0.0083 | 0.025 | Yes | No | No | Yes |
| 6 | 0.031 | 0.0100 | 0.030 | Yes | No | No | No |
| 7 | 0.048 | 0.0125 | 0.035 | Yes | No | No | No |
| 8–10 | 0.12–0.62 | No | No | No | No |
Taken one at a time, seven attributes appear to have changed. Bonferroni and Holm keep two, guarding against any false claim. Benjamini–Hochberg keeps five, accepting that around one in twenty of the reported changes may be spurious. The choice should follow the cost of a false claim compared with the cost of a missed change.
When to adjust, and when not to
Adjustment is not automatic. Rothman (1990) argued that correcting for every comparison in exploratory work makes real effects harder to find and treats unrelated questions as if they were one. Bender and Lange (2001) recommend adjustment when several tests jointly support one confirmatory claim, and clear labelling as exploratory otherwise. Tukey (1991) stressed that the "family" of tests should be defined by the question being answered, not by the whole dataset.
Practical guidance for survey and business data:
- Plan the key comparisons in advance. Name the primary outcome and the few segment comparisons that matter. These need little or no adjustment; everything else is exploratory.
- Watch online experiments. A/B tests often track dozens of metrics and segments and are checked repeatedly; Kohavi et al. (2020) recommend fixed primary metrics, stricter thresholds for secondary ones and caution with segment "wins".
- Prefer estimates to verdicts. Reporting effect sizes with confidence intervals, and shrinking many related estimates towards their average through multilevel models, can reduce spurious extremes without discarding information (Gelman et al., 2012).
- Replicate surprising findings in fresh data before acting on them.
Common mistakes
- Testing every cell of a cross-tabulation and highlighting the "significant" ones without saying how many were examined.
- Treating unadjusted subgroup results as confirmed, especially in small subgroups where chance differences are large.
- Adjusting only the tests that were reported, ignoring the ones that were tried and dropped.
- Using Bonferroni for hundreds of tests when an FDR approach better fits the goal of screening.
Key takeaways
Every extra test adds another chance of a false discovery. Decide in advance which comparisons are confirmatory, control the familywise error rate with Holm when any false claim is costly, and use the false discovery rate when screening many attributes. Above all, report how many comparisons were made, so readers can judge the evidence for themselves.
References
Bender, R., & Lange, S. (2001). Adjusting for multiple testing—when and how? Journal of Clinical Epidemiology, 54(4), 343–349. https://doi.org/10.1016/S0895-4356(00)00314-0
Benjamini, Y., & Hochberg, Y. (1995). Controlling the false discovery rate: A practical and powerful approach to multiple testing. Journal of the Royal Statistical Society Series B: Statistical Methodology, 57(1), 289–300. https://doi.org/10.1111/j.2517-6161.1995.tb02031.x
Benjamini, Y., & Yekutieli, D. (2001). The control of the false discovery rate in multiple testing under dependency. The Annals of Statistics, 29(4), 1165–1188. https://doi.org/10.1214/aos/1013699998
Dunn, O. J. (1961). Multiple comparisons among means. Journal of the American Statistical Association, 56(293), 52–64. https://doi.org/10.1080/01621459.1961.10482090
Gelman, A., Hill, J., & Yajima, M. (2012). Why we (usually) don't have to worry about multiple comparisons. Journal of Research on Educational Effectiveness, 5(2), 189–211. https://doi.org/10.1080/19345747.2011.618213
Holm, S. (1979). A simple sequentially rejective multiple test procedure. Scandinavian Journal of Statistics, 6(2), 65–70.
Ioannidis, J. P. A. (2005). Why most published research findings are false. PLoS Medicine, 2(8), Article e124. https://doi.org/10.1371/journal.pmed.0020124
Kohavi, R., Tang, D., & Xu, Y. (2020). Trustworthy online controlled experiments: A practical guide to A/B testing. Cambridge University Press. https://doi.org/10.1017/9781108653985
Rothman, K. J. (1990). No adjustments are needed for multiple comparisons. Epidemiology, 1(1), 43–46. https://doi.org/10.1097/00001648-199001000-00010
Simmons, J. P., Nelson, L. D., & Simonsohn, U. (2011). False-positive psychology: Undisclosed flexibility in data collection and analysis allows presenting anything as significant. Psychological Science, 22(11), 1359–1366. https://doi.org/10.1177/0956797611417632
Storey, J. D., & Tibshirani, R. (2003). Statistical significance for genomewide studies. Proceedings of the National Academy of Sciences, 100(16), 9440–9445. https://doi.org/10.1073/pnas.1530509100
Tukey, J. W. (1991). The philosophy of multiple comparisons. Statistical Science, 6(1), 100–116. https://doi.org/10.1214/ss/1177011945