
Statistics · Inference
Measurement Error and Its Effects on Statistical Estimates
How random and systematic measurement error distort means, correlations, regression slopes and percentages in survey and business data, and what analysts can do to detect and correct it.
No survey question, sensor or transaction record measures exactly what we intend. A satisfaction score captures mood on the day as well as true satisfaction; a self-reported income is rounded; a brand-awareness question picks up guesses. The gap between the recorded value and the true value is measurement error. It is one component of total survey error (Groves & Lyberg, 2010), and it does more than add noise: it can bias estimates in predictable directions.
Random and systematic error
The classical model writes each observed value X* as the true value X plus an error U:
X* = X + U
If U averages zero and is unrelated to X, the error is random. If U has a non-zero average, or depends on X or on other variables, the error is systematic. Social desirability, for example, pushes reported exercise up and reported alcohol use down, so the error is systematic.
The two types have different consequences. Systematic error biases means and percentages directly: if every respondent overstates spend by 10%, the average is 10% too high however large the sample. Systematic error also arises when the instrument changes: new question wording, or a switch from telephone to online interviewing, can shift a tracker's level overnight, producing a break that looks like a real change in the market. Random error leaves the mean unbiased but inflates the variance, and it damages relationships between variables.
How random error weakens relationships
The key quantity is the reliability of a measure, the share of observed variance that is true-score variance:
λ = var(X) ÷ [var(X) + var(U)]
Spearman (1904) showed that random error reduces correlations. The observed correlation between two measures equals the true correlation multiplied by the square root of the product of their reliabilities, a result known as attenuation. If two attitudes truly correlate at 0.50, and the scales measuring them have reliabilities of 0.7 and 0.8, the expected observed correlation is 0.50 × √(0.7 × 0.8) ≈ 0.37.
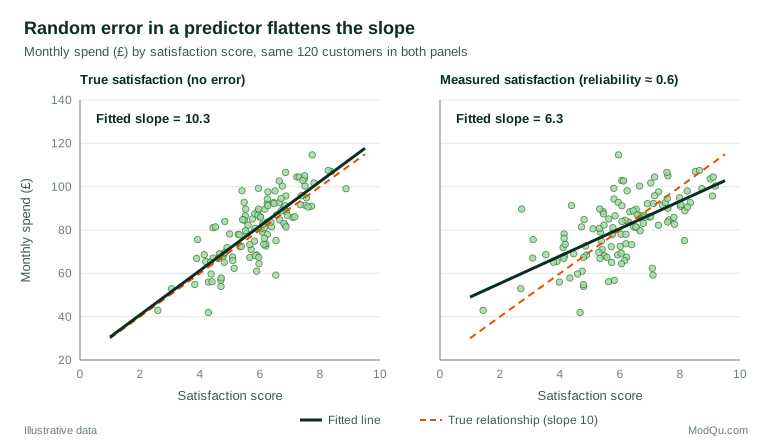
In regression the same mechanism is called regression dilution. Random error in a predictor shrinks its estimated slope towards zero by the factor λ (Fuller, 1987; Hutcheon et al., 2010). Error in the outcome, by contrast, does not bias the slope but makes it less precise.
A worked example
In a hypothetical study of 120 customers, each extra point of satisfaction is truly associated with £10 more monthly spend. Satisfaction is measured with a single survey item whose reliability is about 0.6. The fitted slope falls to roughly £6 per point (Figure 1). A manager using that estimate would underrate the value of improving satisfaction by about 40%.
When the direction of bias is less obvious
The simple rule that random error pulls estimates towards zero holds only for a single error-prone predictor. With several predictors, error in one can bias the others in either direction. A common case is confounding: if a confounder is measured poorly, adjusting for it removes only part of its influence, and the remaining "residual confounding" can create or exaggerate an apparent effect of another variable (Carroll et al., 2006; Keogh et al., 2020). In non-linear models such as logistic regression, the effects are harder to predict still.
Loken and Gelman (2017) add a further warning. In small, noisy studies, the estimates that pass a significance filter tend to be exaggerated, so measurement error can produce overstatement, not only understatement. Noise does not make a surprising finding more convincing.
Misclassification in categorical data
For yes/no measures the equivalent problem is misclassification. If a question has sensitivity Se (the share of true "yes" cases recorded as yes) and specificity Sp (the share of true "no" cases recorded as no), the observed proportion is:
p* = p × Se + (1 − p) × (1 − Sp)
Suppose true awareness of a hypothetical new brand is 10%, with sensitivity 0.90 and specificity 0.95 because some respondents claim to know any plausible name. The survey records 13.5%, an overstatement of a third. Rogan and Gladen (1978) gave the correction:
p = (p* + Sp − 1) ÷ (Se + Sp − 1)
Here (0.135 + 0.95 − 1) ÷ 0.85 = 0.10. Rare categories are most exposed, because even a small false-positive rate is large relative to the true count.
Detecting and correcting measurement error
- Estimate reliability. Use internal consistency for multi-item scales, test–retest designs for single items, or a validation subsample measured with a better instrument (Biemer, 2010).
- Use multi-item scales for key constructs. Averaging several items cancels part of the random error.
- Correct the estimates. Regression calibration replaces the error-prone variable with its expected true value, and simulation–extrapolation (SIMEX) adds extra error deliberately to trace how estimates change, then extrapolates back to zero error (Cook & Stefanski, 1994). Frost and Thompson (2000) compare simple correction methods for regression dilution.
- Use latent variable models, which separate true-score variance from error when several indicators are available.
- Reduce error at source through clear wording, cognitive testing and well-defined response options.
Common mistakes
- Assuming large samples fix measurement error. Sample size reduces sampling error, not bias from error-prone measures.
- Concluding that a weak correlation means a weak relationship. It may reflect unreliable measures.
- Comparing effects across variables measured with different reliability, such as a precise transaction figure and a single attitude item.
- Treating "controlled for" as fully adjusted when the control variable is measured poorly.
Key takeaways
Measurement error is not just noise. Systematic error biases levels directly; random error weakens correlations and slopes, and in multivariable models it can push estimates in either direction. Measure reliability, prefer multi-item scales for key constructs, correct estimates where the stakes justify it, and report how well the main variables were measured.
References
Biemer, P. P. (2010). Total survey error: Design, implementation, and evaluation. Public Opinion Quarterly, 74(5), 817–848. https://doi.org/10.1093/poq/nfq058
Carroll, R. J., Ruppert, D., Stefanski, L. A., & Crainiceanu, C. M. (2006). Measurement error in nonlinear models: A modern perspective (2nd ed.). Chapman and Hall/CRC. https://doi.org/10.1201/9781420010138
Cook, J. R., & Stefanski, L. A. (1994). Simulation-extrapolation estimation in parametric measurement error models. Journal of the American Statistical Association, 89(428), 1314–1328. https://doi.org/10.1080/01621459.1994.10476871
Frost, C., & Thompson, S. G. (2000). Correcting for regression dilution bias: Comparison of methods for a single predictor variable. Journal of the Royal Statistical Society Series A: Statistics in Society, 163(2), 173–189. https://doi.org/10.1111/1467-985X.00164
Fuller, W. A. (1987). Measurement error models. Wiley. https://doi.org/10.1002/9780470316665
Groves, R. M., & Lyberg, L. (2010). Total survey error: Past, present, and future. Public Opinion Quarterly, 74(5), 849–879. https://doi.org/10.1093/poq/nfq065
Hutcheon, J. A., Chiolero, A., & Hanley, J. A. (2010). Random measurement error and regression dilution bias. BMJ, 340, Article c2289. https://doi.org/10.1136/bmj.c2289
Keogh, R. H., Shaw, P. A., Gustafson, P., Carroll, R. J., Deffner, V., Dodd, K. W., Küchenhoff, H., Tooze, J. A., Wallace, M. P., Kipnis, V., & Freedman, L. S. (2020). STRATOS guidance document on measurement error and misclassification of variables in observational epidemiology: Part 1—Basic theory and simple methods of adjustment. Statistics in Medicine, 39(16), 2197–2231. https://doi.org/10.1002/sim.8532
Loken, E., & Gelman, A. (2017). Measurement error and the replication crisis. Science, 355(6325), 584–585. https://doi.org/10.1126/science.aal3618
Rogan, W. J., & Gladen, B. (1978). Estimating prevalence from the results of a screening test. American Journal of Epidemiology, 107(1), 71–76. https://doi.org/10.1093/oxfordjournals.aje.a112510
Spearman, C. (1904). The proof and measurement of association between two things. The American Journal of Psychology, 15(1), 72–101. https://doi.org/10.2307/1412159