
Statistics · Tests and models
Logistic Regression for Binary Outcomes
How logistic regression models yes/no outcomes such as renewal or purchase, how to read its odds ratios and predicted probabilities, and which mistakes to avoid in survey data.
Many business questions have only two possible answers. Did the customer renew? Would the respondent recommend the brand? Did the visitor buy? Logistic regression is the standard tool for relating a yes/no outcome to one or more explanatory variables. It was developed for exactly this kind of data (Cox, 1958) and is now one of the most widely used models in market research, epidemiology and the social sciences (Hosmer et al., 2013).
Why not ordinary regression?
An ordinary straight-line regression on a 0/1 outcome can predict "probabilities" below 0 or above 1, and it assumes the effect of a predictor is the same everywhere on the scale. In reality, a one-point rise in satisfaction matters little for customers who are already almost certain to renew, and a great deal for customers who are undecided. Logistic regression solves both problems by modelling the probability through an S-shaped curve that always stays between 0 and 1.
The model
Instead of modelling the probability p directly, logistic regression models the log-odds, or logit, as a linear function of the predictors:
log(p ÷ (1 − p)) = β0 + β1x1 + … + βkxk
The odds, p ÷ (1 − p), compare the chance that something happens with the chance that it does not. Coefficients are estimated by maximum likelihood rather than least squares. Logistic regression belongs to the wider family of generalised linear models, which link a linear predictor to outcomes that are not normally distributed.
A worked example
Suppose a hypothetical subscription survey of 1,200 customers records whether each customer renewed and their satisfaction score from 0 to 10. The fitted model is:
logit(p) = −4.0 + 0.8 × score
The coefficient 0.8 is on the log-odds scale, which few people find intuitive. Exponentiating it gives the odds ratio: e0.8 ≈ 2.23, so each extra point of satisfaction multiplies the odds of renewal by about 2.2. Converting back to probabilities is often clearer still. A customer scoring 3 has a predicted renewal probability of 17%, a customer scoring 5 has 50%, and a customer scoring 8 has 92%.
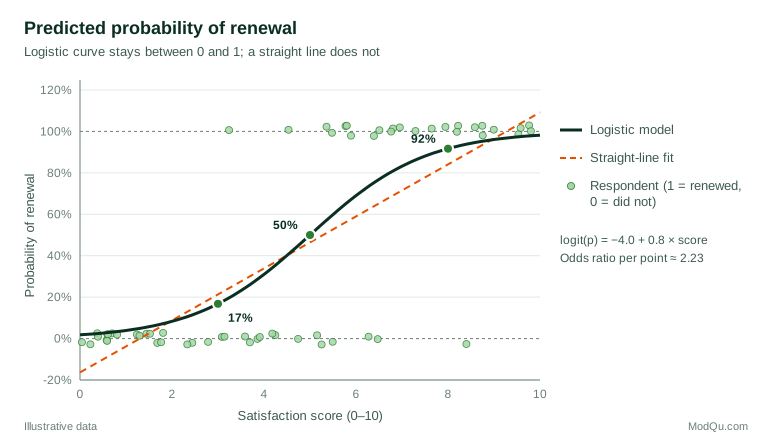
Note that the same 0.8 coefficient moves the probability by different amounts at different points on the curve: from 3 to 4 adds about 14 percentage points, while from 8 to 9 adds only about 5. For business audiences, reporting predicted probabilities or average marginal effects is usually more meaningful than reporting log-odds.
Practical guidance for survey and business data
- Collect enough events. Precision depends on the number of people in the rarer outcome group, not the total sample. A simulation study by Peduzzi et al. (1996) found that estimates became unreliable with fewer than about 10 events per predictor variable.
- Be careful with rare outcomes. When the outcome is very rare, such as a 1% churn rate, standard estimates can understate the probability of the event, and corrections may be needed (King & Zeng, 2001).
- Use survey weights and design-aware standard errors when the data come from a complex or weighted sample.
- Check fit and discrimination. Calibration tests and the area under the ROC curve show whether predicted probabilities match observed rates and separate the two groups well (Hosmer et al., 2013).
Common mistakes
- Reading odds ratios as risk ratios. An odds ratio of 2 does not mean "twice as likely" unless the outcome is rare.
- Comparing coefficients across models or groups. Logistic coefficients change when unrelated variables are added, because the model's scale depends on unobserved variation. Mood (2010) shows why naive comparisons across models, samples or groups can mislead and recommends marginal effects instead.
- Treating associations as causes. A well-fitting model of renewal does not show that raising satisfaction would cause renewal.
Key takeaways
Logistic regression is the natural first model for any yes/no outcome. It keeps predictions between 0 and 1, gives effects as odds ratios, and converts easily to predicted probabilities that decision-makers understand. Use it with enough events per predictor, survey-aware estimation and clear reporting of probabilities rather than log-odds alone.
References
Cox, D. R. (1958). The regression analysis of binary sequences. Journal of the Royal Statistical Society Series B: Statistical Methodology, 20(2), 215–232. https://doi.org/10.1111/j.2517-6161.1958.tb00292.x
Hosmer, D. W., Jr., Lemeshow, S., & Sturdivant, R. X. (2013). Applied logistic regression (3rd ed.). Wiley. https://doi.org/10.1002/9781118548387
King, G., & Zeng, L. (2001). Logistic regression in rare events data. Political Analysis, 9(2), 137–163. https://doi.org/10.1093/oxfordjournals.pan.a004868
Mood, C. (2010). Logistic regression: Why we cannot do what we think we can do, and what we can do about it. European Sociological Review, 26(1), 67–82. https://doi.org/10.1093/esr/jcp006
Peduzzi, P., Concato, J., Kemper, E., Holford, T. R., & Feinstein, A. R. (1996). A simulation study of the number of events per variable in logistic regression analysis. Journal of Clinical Epidemiology, 49(12), 1373–1379. https://doi.org/10.1016/S0895-4356(96)00236-3