
Research · Market and business research
Segmentation Research: Dividing Markets Into Meaningful Groups
What market segmentation research is, the bases and methods used to form segments, how to judge whether a segmentation is any good, and the common reasons segmentation studies fail to change decisions.
Few markets are made up of identical customers. People buy the same product for different reasons, use it in different amounts and respond differently to price, advertising and new features. Market segmentation is the practice of dividing a market into groups of customers who are similar to each other and different from other groups, so that an organisation can decide which groups to serve and how. Segmentation research is the work of collecting and analysing the data used to form those groups and describe them. This article explains where the idea came from, the main bases and methods, how to judge a segmentation, and why many segmentation studies are never put to use.
Origins of the idea
The concept is usually traced to Smith (1956), who described segmentation as an alternative to product differentiation. A firm following a differentiation strategy tries to bend demand towards its product through promotion. A firm following a segmentation strategy accepts that demand is varied and adjusts its products and marketing to fit the needs of distinct groups. Smith saw segmentation as a response to markets in which customers' wants had become more diverse and producers were able to offer more variety.
Over the following decades the idea moved from strategy into research practice. Haley (1968) argued that the benefits people seek from a product are the basic reason segments exist, and that grouping customers by sought benefits was more useful for decisions than grouping them by age or income. Wind (1978) reviewed the field a decade later and set out many of the questions that still guide segmentation studies: which bases to use, how to form segments, and how to judge whether they are worth acting on. Standard textbooks now treat segmentation, targeting and positioning as the core sequence of marketing strategy (Kotler & Keller, 2016).
Why segment at all
Segmentation research serves several practical purposes:
- Choosing targets. A firm with limited resources can concentrate on the groups where it has an advantage or where demand is growing.
- Designing products. Knowing which benefits matter to which groups helps decide what features to build and which product versions to offer.
- Setting prices. Groups that differ in price sensitivity may be served with different price points or packages.
- Planning communication. Segments that differ in media use or in the messages that appeal to them can be reached in different ways.
- Organising the business. Some firms organise sales teams, service levels or product lines around segments.
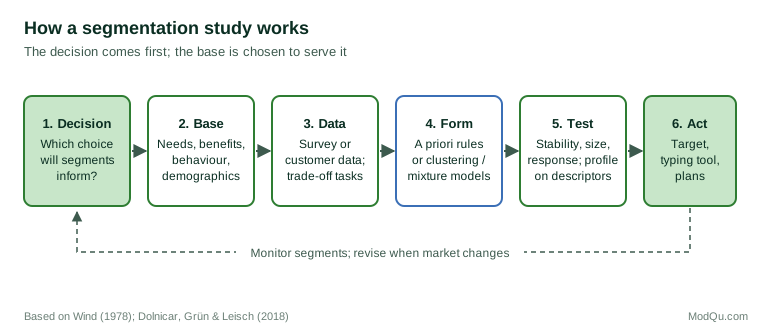
Segmentation is not always worthwhile. Dolnicar et al. (2018) make deciding whether to segment the first step of their process, because a segmentation strategy requires long-term commitment and changes to products, pricing, communication and sometimes the organisation itself. If a firm cannot or will not act differently for different groups, the research has little value.
Bases for segmentation
A segmentation base is the variable or set of variables used to form the groups. Other variables, called descriptors, are then used to describe and reach the segments once they have been formed. The choice of base is the most important decision in a study, because it determines what the segments mean. Wind (1978) stressed that the base should follow from the decision the segmentation is meant to support. Common bases include the following.
Geographic. Region, country, city size or climate. Useful where needs or distribution differ by place, and often used in international markets.
Demographic and socio-economic. Age, gender, household size, income, education and occupation. These are easy to measure and to match with media and customer databases, but on their own they often explain little about why people choose one brand over another.
Psychographic. Values, attitudes, interests and lifestyle. Plummer (1974) described lifestyle segmentation based on activities, interests and opinions, and commercial systems such as VALS grouped consumers by values and lifestyles (Mitchell, 1983). Such segments can be vivid, but they are not always good predictors of purchase.
Behavioural. Usage rate, brand loyalty, purchase occasion, channel used or response to promotions. Behavioural data from transactions and customer records are increasingly available and are usually closer to the decisions a firm needs to make.
Benefits sought and needs. The reasons people buy, measured through questions about what matters to them when choosing. Haley's (1968) toothpaste example identified groups mainly concerned with decay prevention, with bright teeth, with flavour and appearance, or with price, each with its own brand preferences and personality profile.
In business-to-business markets, bases also include firm size, industry, buying process and the structure of the buying group. Wedel and Kamakura (2000) review the full range of bases and note that no single type is best for all purposes; the choice depends on whether the aim is to predict purchase, design products or plan communication.
A priori and data-driven segmentation
Wind (1978) distinguished two broad approaches. In a priori segmentation, the analyst decides the groups in advance, for example heavy, medium and light users, or customers in each age band, and then uses research to describe how the groups differ. In post hoc or data-driven segmentation, the groups are not known in advance. They are found by analysing similarities among respondents on a set of base variables, usually with statistical clustering methods.
Both have a place. A priori segments are simple to understand and to apply, because membership is defined by an observable variable. Data-driven segments can reveal groups that management had not thought of, such as customers who share a combination of needs that cuts across age and income. Their disadvantage is that membership is often defined by a pattern of answers to a long questionnaire, which makes it harder to identify segment members in the wider market. Many studies combine the two, for example by first separating business and consumer customers and then clustering within each group.
Methods for forming segments
Cluster analysis is the most widely used family of methods for data-driven segmentation. Punj and Stewart (1983) reviewed its use in marketing research and described two main types. Hierarchical methods start with each respondent as a separate group and merge the most similar groups step by step; Ward's (1963) method, which merges the pair of groups that adds least to the total within-group variance, is a common choice. Partitioning methods such as k-means (MacQueen, 1967) start with a chosen number of groups and move respondents between them until each is as compact as possible. Punj and Stewart recommended using a hierarchical method to suggest the number of clusters and starting points, then refining the solution with k-means.
Model-based methods, including latent class and finite mixture models, assume that the data come from a mixture of groups, each with its own pattern of responses, and estimate the probability that each respondent belongs to each group (Wedel & Kamakura, 2000). They provide statistical criteria for choosing the number of segments and can handle different types of variables in the same model. Mixture regression models go a step further and form segments of people who respond in the same way to price or product features, which links segmentation directly to choice behaviour.
Rule-based and tree methods split a market on the variables that best predict an outcome such as purchase or churn. The results are easy to explain, because each segment is defined by a few observable rules, but the segments depend heavily on the outcome chosen.
Whatever the method, the input matters as much as the algorithm. Benefit and needs questions answered on rating scales often show response styles: some people rate everything highly, others use the middle of the scale. Clustering such data can produce segments that differ mainly in how people use scales. Ranking tasks or best–worst scaling, in which respondents repeatedly pick the most and least important items from a set, force trade-offs and reduce this problem (Louviere et al., 2015). Analysts also need to decide which variables to include, how to handle missing data and whether to standardise variables before clustering, because each decision changes the result.
How many segments?
Clustering algorithms will always produce groups, even in data with no real structure. Choosing the number of segments therefore requires judgement supported by evidence. Statistical aids include the change in within-group variance as clusters are added, the silhouette width, which compares how close each case is to its own cluster with how close it is to the nearest other cluster (Rousseeuw, 1987), and the gap statistic, which compares the observed clustering with what would be expected from data with no clusters (Tibshirani et al., 2001). Model-based methods use information criteria that balance fit against complexity.
Dolnicar et al. (2018) recommend also testing stability: repeating the analysis on many resampled versions of the data and checking whether the same segments appear each time. If a solution changes substantially from one sample to the next, the segments are more likely to be artefacts of the method than features of the market. In many consumer data sets, the authors note, there are no clearly separated natural clusters, and segmentation is better understood as constructing useful groups from continuous variation than as discovering groups that already exist.
The practical limit matters too. A solution with twelve segments may fit the data better than one with five, but few organisations can design and run twelve different marketing programmes. Managers usually prefer a small number of segments that are distinct, sizeable and easy to explain.
Judging a segmentation
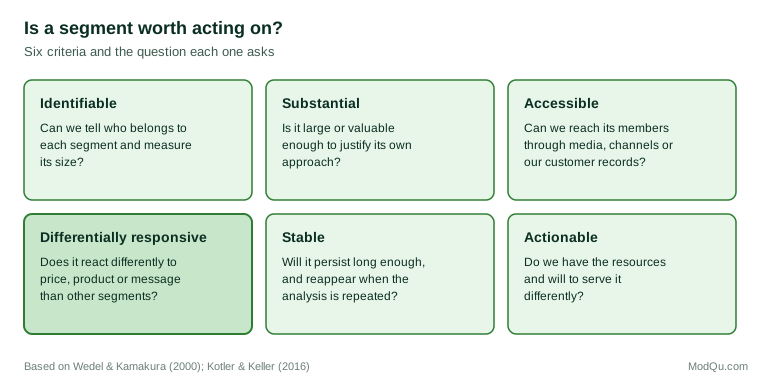
Textbooks and reviews list several criteria that segments should meet before they are used (Kotler & Keller, 2016; Wedel & Kamakura, 2000):
- Identifiable and measurable. It must be possible to tell who belongs to each segment and how large it is.
- Substantial. Each target segment must be large or valuable enough to justify a separate approach.
- Accessible. The firm must be able to reach segment members through media, channels or its own customer records.
- Differentially responsive. Segments must respond differently to the marketing actions being considered. If all groups react the same way to a price change or a new message, separating them adds nothing.
- Stable. Segments should persist long enough for the firm to develop and run a strategy for them.
- Actionable. The firm must have the resources and willingness to serve the segments differently.
A useful test of accessibility is whether segment membership can be predicted from a small number of questions or from data held in a customer database. Many studies therefore build a short classification algorithm, often called a typing tool, that assigns new respondents or customers to segments using a handful of questions. If no short set of questions predicts membership well, the segments will be hard to use in sampling, targeting or tracking.
Profiling and bringing segments to life
Once segments are formed, they are profiled on descriptors such as demographics, media use, brand use and attitudes. Profiling shows where each segment can be found and what it looks like. Segments are often given names and written up as short portraits. These help people inside an organisation remember and discuss the segments, but they can also mislead.
Yankelovich and Meer (2006) argued that many segmentations had drifted towards producing memorable consumer characters for advertising, while losing their link to purchase behaviour. They recommended that segmentation should start from the business decision and focus on the attitudes and behaviours that drive purchase in the specific category, rather than on general lifestyle descriptions. A segment portrait that is vivid but does not predict what people buy is of little use for product or pricing decisions.
Why segmentation studies fail
Segmentation research has a reputation for producing reports that are admired and then ignored. Several causes recur.
No clear decision. Studies commissioned to "understand the market" without a specific decision in view tend to use broad bases and produce segments that do not map onto any action.
Poor understanding of the method. Dolnicar and Lazarevski (2009) surveyed marketing managers and found that many lacked a basic understanding of segmentation methodology; more than 60% said that segmentation analysis was like a black box to them. Managers who do not know how the segments were formed tend to overestimate their validity and have difficulty interpreting them.
Segments that do not differ in behaviour. Research in the tradition of Ehrenberg has found that competing brands within a category usually sell to customers with very similar profiles. Hammond et al. (1996) analysed many product categories and found that the customer bases of competing brands seldom differed much in their demographic profiles. Sharp (2010) used similar evidence to argue that brands compete mainly for the same broad pool of category buyers. This does not make segmentation useless, but it warns against assuming that each brand must have a distinct target segment, and it supports testing whether segments really differ in what and how much they buy.
Implementation barriers. Dibb (1998) noted that segmentation projects often stall because the organisation's structure, data systems and culture are not set up to act on them. Segments need to be built into planning, customer databases and performance measures, not only into the research report.
Instability. Segmentations built on unstable clustering solutions, or on attitudes that change quickly, may produce different groups each time the study is repeated. This undermines trust in the results and makes tracking impossible.
Good practice
The evidence and experience reviewed above point to a set of practices that make segmentation research more useful:
- Start with the decision. State which choices the segmentation will inform, such as which product versions to offer or which customers to target, and choose bases accordingly (Wind, 1978).
- Use bases close to behaviour. Needs, benefits and behaviour in the category usually predict purchase better than general demographics or lifestyle measures.
- Design the input data carefully. Use question formats that force trade-offs, check for response styles, and test the questionnaire before fieldwork.
- Compare several solutions. Examine different numbers of segments and methods, check stability through resampling, and choose a solution that is both statistically defensible and useful (Dolnicar et al., 2018).
- Test differential response. Check whether segments differ on the outcomes that matter, such as purchase intention, price sensitivity or response to product concepts.
- Build a typing tool. Make sure segment members can be identified in future surveys and in customer records.
- Explain the method. Give decision makers a plain account of how segments were formed and how confident they can be in them.
- Monitor over time. Track segment sizes and behaviour, and revise the segmentation when the market changes.
Segmentation research is most valuable when it is treated as a tool for a specific set of decisions and is built into how an organisation plans and measures its work. A modest number of well-defined, stable segments that can be identified and that respond differently to marketing actions is worth more than an elaborate solution that nobody can apply.
References
Dibb, S. (1998). Market segmentation: Strategies for success. Marketing Intelligence & Planning, 16(7), 394–406.
Dolnicar, S., Grün, B., & Leisch, F. (2018). Market segmentation analysis: Understanding it, doing it, and making it useful. Springer. https://doi.org/10.1007/978-981-10-8818-6
Dolnicar, S., & Lazarevski, K. (2009). Methodological reasons for the theory/practice divide in market segmentation. Journal of Marketing Management, 25(3–4), 357–373.
Haley, R. I. (1968). Benefit segmentation: A decision-oriented research tool. Journal of Marketing, 32(3), 30–35.
Hammond, K., Ehrenberg, A. S. C., & Goodhardt, G. J. (1996). Market segmentation for competitive brands. European Journal of Marketing, 30(12), 39–49.
Kotler, P., & Keller, K. L. (2016). Marketing management (15th ed.). Pearson.
Louviere, J. J., Flynn, T. N., & Marley, A. A. J. (2015). Best-worst scaling: Theory, methods and applications. Cambridge University Press.
MacQueen, J. (1967). Some methods for classification and analysis of multivariate observations. In L. M. Le Cam & J. Neyman (Eds.), Proceedings of the Fifth Berkeley Symposium on Mathematical Statistics and Probability (Vol. 1, pp. 281–297). University of California Press.
Mitchell, A. (1983). The nine American lifestyles: Who we are and where we're going. Macmillan.
Plummer, J. T. (1974). The concept and application of life style segmentation. Journal of Marketing, 38(1), 33–37.
Punj, G., & Stewart, D. W. (1983). Cluster analysis in marketing research: Review and suggestions for application. Journal of Marketing Research, 20(2), 134–148.
Rousseeuw, P. J. (1987). Silhouettes: A graphical aid to the interpretation and validation of cluster analysis. Journal of Computational and Applied Mathematics, 20, 53–65. https://doi.org/10.1016/0377-0427(87)90125-7
Sharp, B. (2010). How brands grow: What marketers don't know. Oxford University Press.
Smith, W. R. (1956). Product differentiation and market segmentation as alternative marketing strategies. Journal of Marketing, 21(1), 3–8.
Tibshirani, R., Walther, G., & Hastie, T. (2001). Estimating the number of clusters in a data set via the gap statistic. Journal of the Royal Statistical Society: Series B (Statistical Methodology), 63(2), 411–423. https://doi.org/10.1111/1467-9868.00293
Ward, J. H., Jr. (1963). Hierarchical grouping to optimize an objective function. Journal of the American Statistical Association, 58(301), 236–244. https://doi.org/10.1080/01621459.1963.10500845
Wedel, M., & Kamakura, W. A. (2000). Market segmentation: Conceptual and methodological foundations (2nd ed.). Kluwer Academic.
Wind, Y. (1978). Issues and advances in segmentation research. Journal of Marketing Research, 15(3), 317–337.
Yankelovich, D., & Meer, D. (2006). Rediscovering market segmentation. Harvard Business Review, 84(2), 122–131.