
Research · Market and business research
Advertising Research: Pre-Testing and Post-Testing Campaigns
How advertising is tested before it runs and evaluated after it runs, which measures relate to sales, and why controlled experiments give the most reliable estimates of advertising effects.
Advertising is expensive, and its effects are hard to see. Sales move for many reasons at once: price, distribution, competitor activity, the season and the economy. Advertising research tries to answer two practical questions. Before a campaign runs, will this advertisement work, and is it better than the alternatives? After it has run, what did it achieve? The first is the job of pre-testing; the second is the job of post-testing, also called campaign evaluation. This article describes the main methods for each and what the evidence says about their value.
What advertising is expected to do
Every test assumes a view of how advertising works. Older hierarchy models, such as the sequence proposed by Lavidge and Steiner (1961), assume that people move through stages from awareness and knowledge to liking, preference, conviction and purchase. Tests built on these models measure recall, message understanding and persuasion. Vakratsas and Ambler (1999) reviewed over 250 studies and found little support for a fixed hierarchy; advertising can work through memory, emotion and experience in different orders depending on the product and the buyer. A test should therefore measure the effects the campaign is designed to produce, and more than one kind of effect.
The view taken also affects what counts as success. Ehrenberg (1974) argued that much advertising for established brands works mainly by reminding existing buyers and reinforcing habits, rather than by persuading people to switch. Under this view, a campaign that holds a brand's sales steady against competitors may be doing its job even if no increase is visible. Tests that look only for persuasion shifts will miss this kind of effect.
Pre-testing
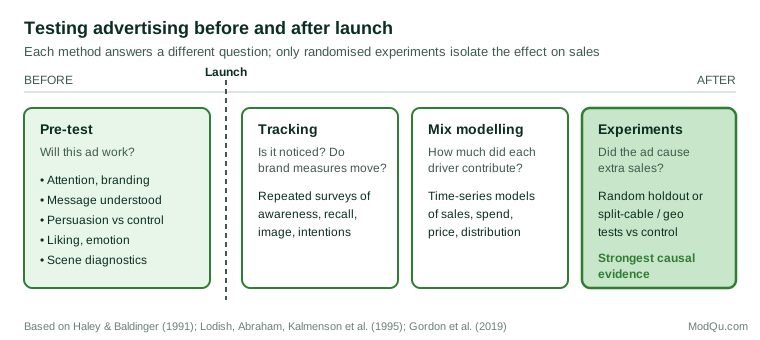
Pre-testing, or copy testing, evaluates advertisements before they are released, usually at the rough or finished stage. Common measures include:
- Attention and recall: whether the advertisement is noticed and remembered, and whether the brand is correctly linked to it.
- Communication: whether the intended message is understood.
- Persuasion: change in brand preference or purchase intention after exposure, compared with a control group or a pre-exposure measure.
- Liking and emotional response: how much viewers enjoy the advertisement and how they feel while watching it.
- Diagnostics: moment-by-moment reactions, confusion, and which scenes hold or lose attention.
The industry has long debated which of these measures predict sales. The Advertising Research Foundation's Copy Research Validity Project tested five pairs of television commercials whose relative sales effects were already known from split-cable experiments, using several copy-testing methods and many measures (Haley & Baldinger, 1991). The study concluded that copy testing does relate to sales and that no single measure is sufficient. Its most discussed finding was that measures of how much people liked the commercial identified the sales winner more often than had been expected. Because the study used only five pairs of packaged-goods advertisements, its authors cautioned against rejecting any method on its basis.
Post-testing and campaign evaluation
Post-testing measures what happened once a campaign has run. Three broad approaches are used.
Tracking studies survey samples of the target market continuously or at regular intervals, measuring brand awareness, advertising recall, image and purchase intentions. Changes are compared with the timing and weight of advertising. Tracking shows whether the campaign is noticed and whether brand measures move, but it cannot on its own prove that advertising caused any change in sales.
Marketing mix modelling uses statistical models of time-series data on sales, advertising spending by channel, price, distribution and external factors to estimate the contribution of each to sales. Such models can separate short-term and longer-term effects. Their estimates depend on the model's structure and on there being enough independent variation in spending to separate its effect from other factors.
Single-source data link each household's exposure to advertising with its purchases. Jones (1995) used such data to compare purchases by households that had seen a brand's advertising in the days before buying in the category with purchases by those that had not, and found large differences between campaigns in their short-term effect. Because exposure is not randomly assigned, such comparisons can be affected by differences between viewers and non-viewers.
Controlled experiments randomly assign people or areas to see the advertising or not, and compare outcomes. Randomisation removes the confusion between advertising and other causes, so experiments give the most reliable estimates of causal effects.
What experiments have shown
Large field experiments have produced some of the most useful findings in advertising research. Lodish, Abraham, Kalmenson et al. (1995) analysed 389 split-cable television experiments, in which households in the same market received different advertising through their cable connection and their purchases were recorded through scanner panels. They found that increasing advertising weight often did not increase sales of established brands, that advertising was more likely to work for new products, and that standard recall and persuasion scores were not clearly related to sales effects. These results showed that many campaigns had smaller effects than their sponsors assumed.
Online advertising allows experiments on a much larger scale. Gordon et al. (2019) analysed 15 large randomised advertising experiments on Facebook and compared the experimental results with estimates from common observational methods applied to the same data. The observational methods often failed to recover the effects measured by the experiments, sometimes overestimating them substantially, even after controlling for many demographic and behavioural variables. Lewis and Rao (2015) showed a related problem: because individual purchases vary so much and advertising effects per person are small, experiments need very large samples to detect whether a campaign was profitable. Johnson et al. (2017) developed a method, known as ghost ads, that identifies the users in a control group who would have seen an advertisement, which makes online experiments cheaper and more precise.
Not all effects appear quickly. In a companion analysis of split-cable tests, Lodish, Abraham, Livelsberger et al. (1995) followed up advertising tests that had increased sales in their first year and found that the effect continued over the following two years, so that the cumulative effect was roughly twice the first-year effect. Tests that had shown no first-year effect did not show later gains. Evaluations that measure only immediate sales may therefore understate an effective campaign's value, but they are unlikely to miss a campaign that had no short-term effect at all.
Good practice
- Set objectives first. Define what the campaign is meant to change, and for whom, before choosing measures.
- Use several measures in pre-tests. Combine attention, branding, communication, persuasion and liking rather than relying on one score (Haley & Baldinger, 1991).
- Test against a control. Measure change relative to people who have not seen the advertising.
- Prefer experiments where feasible. Use randomised holdout groups or geographic tests to estimate sales effects, and treat observational estimates with caution (Gordon et al., 2019).
- Plan sample sizes. Make sure an experiment is large enough to detect the effect that would make the campaign worthwhile (Lewis & Rao, 2015).
- Look beyond the short term. Track brand measures and sales after the campaign ends. Binet and Field (2013), analysing campaigns submitted to the IPA Effectiveness Awards, found that campaigns aimed at long-term brand building and those aimed at short-term sales activation produced different patterns of results, and recommended evaluating both.
References
Binet, L., & Field, P. (2013). The long and the short of it: Balancing short and long-term marketing strategies. Institute of Practitioners in Advertising.
Ehrenberg, A. S. C. (1974). Repetitive advertising and the consumer. Journal of Advertising Research, 14(2), 25–34.
Gordon, B. R., Zettelmeyer, F., Bhargava, N., & Chapsky, D. (2019). A comparison of approaches to advertising measurement: Evidence from big field experiments at Facebook. Marketing Science, 38(2), 193–225. https://doi.org/10.1287/mksc.2018.1135
Haley, R. I., & Baldinger, A. L. (1991). The ARF copy research validity project. Journal of Advertising Research, 31(2), 11–32.
Johnson, G. A., Lewis, R. A., & Nubbemeyer, E. I. (2017). Ghost ads: Improving the economics of measuring online ad effectiveness. Journal of Marketing Research, 54(6), 867–884. https://doi.org/10.1509/jmr.15.0297
Jones, J. P. (1995). When ads work: New proof that advertising triggers sales. Lexington Books.
Lavidge, R. J., & Steiner, G. A. (1961). A model for predictive measurements of advertising effectiveness. Journal of Marketing, 25(6), 59–62.
Lewis, R. A., & Rao, J. M. (2015). The unfavorable economics of measuring the returns to advertising. The Quarterly Journal of Economics, 130(4), 1941–1973. https://doi.org/10.1093/qje/qjv023
Lodish, L. M., Abraham, M., Kalmenson, S., Livelsberger, J., Lubetkin, B., Richardson, B., & Stevens, M. E. (1995). How T.V. advertising works: A meta-analysis of 389 real world split cable T.V. advertising experiments. Journal of Marketing Research, 32(2), 125–139.
Lodish, L. M., Abraham, M. M., Livelsberger, J., Lubetkin, B., Richardson, B., & Stevens, M. E. (1995). A summary of fifty-five in-market experimental estimates of the long-term effect of TV advertising. Marketing Science, 14(3, Suppl.), G133–G140.
Vakratsas, D., & Ambler, T. (1999). How advertising works: What do we really know? Journal of Marketing, 63(1), 26–43.