
Research · Market and business research
Usage and Attitude Studies
What usage and attitude (U&A) studies measure, how they are designed and analysed, what the evidence says about the link between attitudes and buying, and how to avoid common errors.
A usage and attitude study, usually shortened to U&A, is a large survey that describes how a product category is bought and used and what people think about the brands in it. It is one of the most common types of commissioned market research. A firm entering a new market, relaunching a brand or planning several years of marketing often starts with a U&A study, because it gives a broad factual baseline that later research can build on. This article describes what U&A studies cover, how they are designed and analysed, and what the evidence says about interpreting their results.
What a U&A study covers
The study has two halves. The usage half measures behaviour: who buys and uses the category, how often, in what amounts, on which occasions, through which channels and at what prices. The attitude half measures what people know, believe and feel: which brands they are aware of, which they would consider, what they associate with each brand, how satisfied they are and what they want from the category. Together these describe the market as it stands and help explain why brands hold the positions they do.
Typical topics include:
- Category penetration and frequency: the share of the population that buys or uses the category, and how often.
- Brand awareness: unprompted (spontaneous) recall and prompted recognition of each brand.
- Brand usage: brands ever used, used recently and used most often.
- Purchase and usage occasions: where, when, with whom and for what purpose the product is used.
- Brand image: which attributes people associate with each brand.
- Needs and choice drivers: what matters when choosing in the category.
- Satisfaction, loyalty and intentions: satisfaction with the current brand, likelihood to recommend and intention to buy again.
- Media and demographics: used to describe and reach different groups.
Design
Population and sample. The first decision is whom the study should represent. A study of category users only is cheaper, but it cannot measure category penetration or describe non-users, who may be the main source of growth. Many studies therefore screen a representative sample of the general population, record category use for everyone, and give the full questionnaire to users. Samples need to be large enough to describe smaller brands and important subgroups; a brand used by 3% of respondents will have very few users in a sample of 1,000.
Qualitative groundwork. The attribute lists, occasion lists and need statements used in the survey should come from the market, not from the brand team's assumptions. Interviews or group discussions with category users before the questionnaire is written help to identify the language people use, the occasions that matter and the attributes they consider when choosing. Without this step, a study can measure the wrong things very precisely.
Mode of data collection. Most U&A studies are now carried out online, which is cheaper and allows images of packs and logos to be shown. Online panels may under-represent older people, people with low incomes and people with little internet access, so the choice of mode and the weighting of results need to reflect who is in the category. For some categories and countries, telephone or face-to-face interviews remain necessary to reach a representative sample.
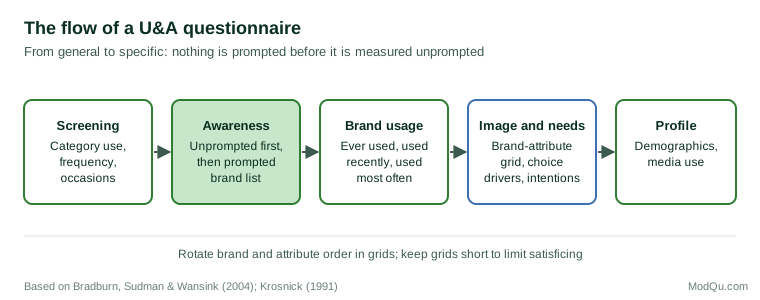
Questionnaire structure. Order matters. Unprompted awareness must be asked before any brand names are shown, or the answers will be contaminated. A common structure moves from general to specific: category behaviour, then unprompted awareness, prompted awareness, brand usage, brand image, needs and attitudes, and finally demographics. Bradburn et al. (2004) give detailed guidance on question order, wording and the risk that earlier questions change answers to later ones.
Measuring behaviour. Survey questions about past behaviour depend on memory. Respondents may forget purchases, or may place them inside the reference period when they happened earlier, a problem known as telescoping (Neter & Waksberg, 1964). Shorter, clearly defined reference periods ("in the past four weeks") and questions about specific occasions reduce these errors. Tourangeau et al. (2000) describe how respondents answer survey questions through stages of comprehension, retrieval, judgement and response, and how errors can enter at each stage. Where possible, U&A results on purchasing should be checked against sales data, retail panel data or loyalty card data.
Measuring image. Brand image is usually measured with a grid of brands and attributes. One common format asks respondents to pick, for each attribute, all the brands they think it describes ("free choice" or "pick any"). Another asks for a rating of each brand on each attribute. Rating grids are long and tiring, and Krosnick (1991) showed that respondents faced with demanding questions often give answers that are merely acceptable rather than carefully considered, a behaviour he called satisficing. Keeping grids short, limiting the number of brands each person rates, and rotating the order of brands and attributes help to reduce this.
Analysis
The brand funnel. A standard output is a sequence of measures for each brand, from awareness through consideration and trial to regular use. The conversion rate from one stage to the next is often more informative than the stage totals, because it shows where a brand loses potential customers. A brand with high awareness but low conversion to trial may have an image or availability problem; one with good trial but poor conversion to regular use may have a product problem. The concept reflects older hierarchy models of how buyers move from awareness towards purchase.
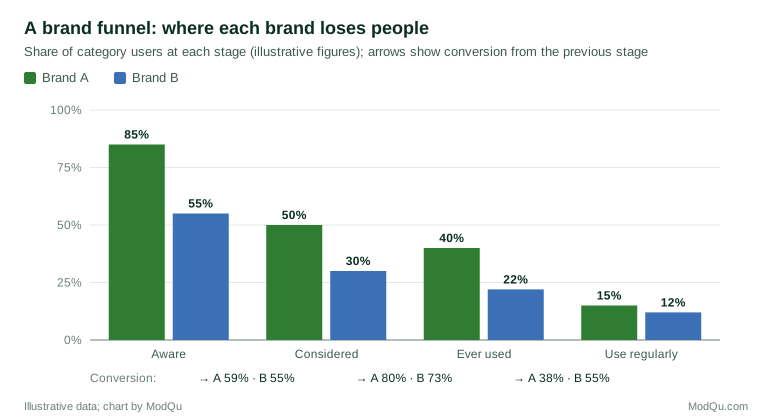
Image analysis and brand size. A central finding of research on brand image is that larger brands receive more attribute associations simply because more people use them. Bird et al. (1970) showed that people who use a brand are much more likely to associate it with attributes than people who do not, and that this pattern is consistent across brands. Romaniuk et al. (2012) tested this generalisation four decades later in many product categories and found it still held. The practical consequence is that raw image scores largely reflect brand size. A small brand will appear weaker on almost every attribute. To find a brand's distinctive strengths, analysts compare its scores with the level expected for a brand of its size, or analyse users and non-users separately.
Repeat reliability. Individual answers to image questions are less stable than aggregate results suggest. Dall'Olmo Riley et al. (1997) re-interviewed the same respondents and found that many who associated a brand with an attribute on one occasion did not do so on the second, even though the overall percentages for the brand stayed much the same. Aggregate image scores can therefore be stable and useful while individual-level image data are too noisy to support strong conclusions about particular respondents.
Benchmarks for loyalty. Usage data are often used to judge whether a brand's customers are unusually loyal. Ehrenberg et al. (2004) showed that brand performance measures such as purchase frequency and share of category requirements follow regular patterns that are largely predictable from a brand's market share, using the Dirichlet model. Smaller brands have fewer buyers who also buy them slightly less often, a pattern known as double jeopardy. Comparing observed loyalty with these benchmarks prevents a small brand's lower loyalty from being misread as a specific problem.
Drivers of choice. Analysts often estimate which attributes are most closely related to brand preference or satisfaction, using correlation or regression. Such "driver analysis" describes associations, not causes. Because users rate their own brand more favourably on almost everything, attributes may appear to drive preference when they are partly a result of it.
Attitudes, intentions and behaviour
The attitude half of a U&A study rests on the assumption that what people believe and intend relates to what they do. Psychological research supports a link but shows it to be conditional. Fishbein and Ajzen (1975) argued that attitudes predict behaviour best when both are measured at the same level of specificity, and that intentions are the closest predictor of behaviour. Ajzen's (1991) theory of planned behaviour adds the person's perceived control over the action.
For purchase intentions, the evidence is mixed. Morwitz et al. (2007) analysed many studies and found that stated purchase intentions are more closely related to actual purchase for existing products than for new ones, for durable goods than for non-durables, and when intentions are about specific brands or models rather than whole categories. Stated intentions also need calibrating; Juster (1966) showed that asking for a purchase probability on an 11-point scale predicted later buying better than a simple intention question. U&A studies should therefore treat intention scores as indicators to be compared across brands and over time, not as forecasts of sales.
Many U&A studies include a recommendation question. Reichheld (2003) proposed that the share of customers who would strongly recommend a company, minus the share who would not, predicted company growth better than other measures. Keiningham et al. (2007) tested this using data from Norwegian firms and did not find that it consistently outperformed other measures such as customer satisfaction. Recommendation scores can be useful descriptive measures, but they do not replace a balanced set of indicators.
Brand equity and salience
U&A data are often used to assess brand equity. Keller (1993) defined customer-based brand equity as the effect that brand knowledge, consisting of awareness and associations, has on how customers respond to the brand's marketing. Aaker (1996) proposed a set of measures, including loyalty, perceived quality, associations and awareness, that could be compared across products and markets. Romaniuk and Sharp (2004) argued that a brand's salience, the likelihood of it coming to mind in buying situations, depends on the number and strength of its links to category cues such as occasions and needs. This favours measuring brand associations with category situations ("which brands would you consider for a quick lunch?") rather than only abstract brand qualities.
Using U&A results well
A U&A study produces hundreds of tables, and its usefulness depends on interpretation. Several practices help:
- Define the decisions first. Agree which questions the study must answer and design the questionnaire around them, rather than measuring everything that might be of interest.
- Size the market from behaviour. Use penetration and frequency data to estimate volumes, and check them against sales or panel data where available.
- Adjust image for brand size. Compare each brand's associations with the level expected for its user base before drawing conclusions about strengths and weaknesses (Romaniuk et al., 2012).
- Use benchmarks for loyalty. Compare loyalty measures with what is normal for a brand of that size (Ehrenberg et al., 2004).
- Treat intentions with caution. Use them for comparison and tracking, not as direct sales forecasts (Morwitz et al., 2007).
- Look at non-users and light users. Most brands depend on a large number of light buyers, so their awareness and perceptions matter (Sharp, 2010).
- Plan for repetition. A U&A study is most valuable as a baseline. Keeping core questions identical allows later waves or tracking studies to measure change.
Carried out with these points in mind, a U&A study gives an organisation a factual picture of its market: how big it is, who buys, how they use the product, and how the brands are seen. That picture is the basis for segmentation, product development, positioning and the measurement of marketing effects.
References
Aaker, D. A. (1996). Measuring brand equity across products and markets. California Management Review, 38(3), 102–120.
Ajzen, I. (1991). The theory of planned behavior. Organizational Behavior and Human Decision Processes, 50(2), 179–211. https://doi.org/10.1016/0749-5978(91)90020-T
Bird, M., Channon, C., & Ehrenberg, A. S. C. (1970). Brand image and brand usage. Journal of Marketing Research, 7(3), 307–314.
Bradburn, N. M., Sudman, S., & Wansink, B. (2004). Asking questions: The definitive guide to questionnaire design—for market research, political polls, and social and health questionnaires (Rev. ed.). Jossey-Bass.
Dall'Olmo Riley, F., Ehrenberg, A. S. C., Castleberry, S. B., Barwise, T. P., & Barnard, N. R. (1997). The variability of attitudinal repeat-rates. International Journal of Research in Marketing, 14(5), 437–450.
Ehrenberg, A. S. C., Uncles, M. D., & Goodhardt, G. J. (2004). Understanding brand performance measures: Using Dirichlet benchmarks. Journal of Business Research, 57(12), 1307–1325.
Fishbein, M., & Ajzen, I. (1975). Belief, attitude, intention, and behavior: An introduction to theory and research. Addison-Wesley.
Juster, F. T. (1966). Consumer buying intentions and purchase probability: An experiment in survey design. Journal of the American Statistical Association, 61(315), 658–696.
Keiningham, T. L., Cooil, B., Andreassen, T. W., & Aksoy, L. (2007). A longitudinal examination of net promoter and firm revenue growth. Journal of Marketing, 71(3), 39–51. https://doi.org/10.1509/jmkg.71.3.039
Keller, K. L. (1993). Conceptualizing, measuring, and managing customer-based brand equity. Journal of Marketing, 57(1), 1–22. https://doi.org/10.1177/002224299305700101
Krosnick, J. A. (1991). Response strategies for coping with the cognitive demands of attitude measures in surveys. Applied Cognitive Psychology, 5(3), 213–236. https://doi.org/10.1002/acp.2350050305
Morwitz, V. G., Steckel, J. H., & Gupta, A. (2007). When do purchase intentions predict sales? International Journal of Forecasting, 23(3), 347–364.
Neter, J., & Waksberg, J. (1964). A study of response errors in expenditures data from household interviews. Journal of the American Statistical Association, 59(305), 18–55.
Reichheld, F. F. (2003). The one number you need to grow. Harvard Business Review, 81(12), 46–54.
Romaniuk, J., Bogomolova, S., & Dall'Olmo Riley, F. (2012). Brand image and brand usage: Is a forty-year-old empirical generalization still useful? Journal of Advertising Research, 52(2), 243–251.
Romaniuk, J., & Sharp, B. (2004). Conceptualizing and measuring brand salience. Marketing Theory, 4(4), 327–342.
Sharp, B. (2010). How brands grow: What marketers don't know. Oxford University Press.
Tourangeau, R., Rips, L. J., & Rasinski, K. (2000). The psychology of survey response. Cambridge University Press.