
Research · Qualitative research
Participatory Mapping and Visual Methods in Community Knowledge Generation
How participatory mapping, photovoice, photo elicitation and other visual methods let communities produce and interpret knowledge about their own places and lives, with their strengths, limits and ethical questions.
Much of what people know about their communities is hard to put into words in an interview. Where is it safe to walk at night? Which places matter, and why? How do resources, services and risks spread across a neighbourhood? Participatory mapping and other visual methods invite people to show what they know by drawing, mapping, photographing and discussing images. Because participants create the material, these methods shift some control over knowledge production from the researcher to the community. This article explains the main methods, what they contribute and where they need care.
Origins
Visual and mapping methods grew from participatory development practice. Chambers (1994) described how participatory rural appraisal used maps drawn on the ground, seasonal calendars, ranking exercises and diagrams to allow villagers to share and analyse their own knowledge with outsiders. A central insight was that local people often knew far more about their environment than visiting experts assumed, and that visual techniques let people with little formal education present that knowledge on equal terms. Cornwall and Jewkes (1995) placed these practices within the broader tradition of participatory research, in which the people being studied take part in defining questions, producing data and interpreting results.
Participatory mapping
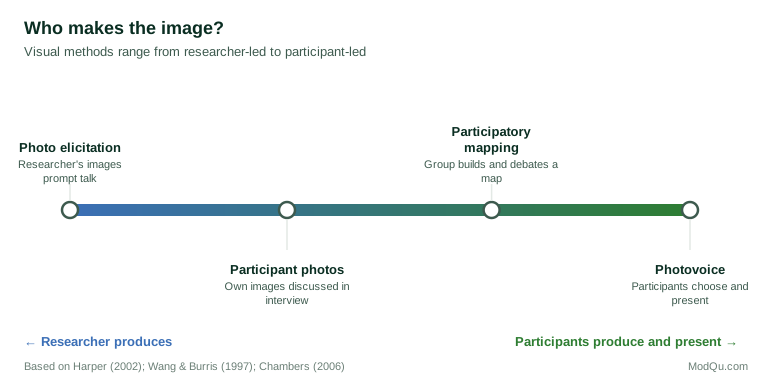
In participatory mapping, community members create maps of their area showing what matters to them: homes, resources, boundaries, hazards, services, routes and places of meaning. Maps may be sketched on paper or the ground, built as three-dimensional models, or produced with digital mapping tools. Rambaldi et al. (2006) described the growth of participatory geographic information systems, which combine local knowledge with digital spatial data.
The process of making a map is often as important as the result. Discussion around the map reveals disagreements, priorities and explanations that a finished map alone would not show. Kesby (2000) argued that participatory diagramming should be understood as a research method in its own right, in which the diagram acts as a focus for group discussion and analysis.
Mapping also raises questions of power. Chambers (2006) asked whose map is produced, who is empowered and who is disempowered. Maps can strengthen communities' claims to land and resources, but they can also expose local knowledge to outsiders, freeze changing arrangements into fixed boundaries, and give more voice to the people who hold the pen.
Photovoice and photo elicitation
Wang and Burris (1997) developed photovoice, in which participants are given cameras and asked to photograph aspects of their lives related to a research question. Participants then select images, discuss them in groups and decide which to present to decision-makers. The method has three aims: to record a community's strengths and concerns, to promote critical discussion, and to reach policymakers. Catalani and Minkler (2010) reviewed photovoice studies in health and found that the method was widely used to engage communities, though the depth of participation and the evidence of action varied.
Photo elicitation uses photographs, taken by participants or the researcher, as prompts in interviews. Harper (2002) argued that images evoke deeper elements of memory and feeling than words alone, and that discussing a photograph allows participant and researcher to explore its meaning together.
The diagram below places these methods on a spectrum of who produces the visual material.
Running a mapping or photovoice project
A typical project moves through several steps. The research team and community partners agree the question and who should take part. Participants are introduced to the method and its ethical rules, then produce material: a map in a workshop, or photographs over several weeks. Groups meet to discuss the material, explain what each map feature or image means, and identify common themes. Finally, participants help decide what to present, to whom and in what form, often through an exhibition or a meeting with decision-makers (Wang & Burris, 1997). Each step should be documented, because the choices made along the way shape the findings.
Interpreting visual material
Images do not interpret themselves. Rose (2016) emphasised that the meaning of an image depends on how it was produced, what it shows and how audiences see it. In participatory methods, the participant's own explanation is central: a photograph of an empty bus stop may mean danger to one person and freedom to another. Guillemin and Drew (2010) noted that researchers need to consider the whole process, from how images are produced to how they are discussed, selected and presented, because each stage shapes what knowledge results.
Ethics
Visual methods raise particular ethical questions. Photographs may show people who have not consented, maps may reveal sensitive locations, and images are harder to anonymise than text. Participants should be trained in ethical image-making, and agreements should cover who owns the images and how they may be used. Wang and Burris (1997) recommended explicit guidance on photographing other people and obtaining their consent.
Applied uses
Visual and mapping methods are well suited to community planning, service design and needs assessment. A hypothetical example: a city council asks residents to map where they feel unsafe. The maps show clusters around poorly lit underpasses, and discussion reveals that residents avoid a new park because its entrances are hidden from the street. The findings guide lighting and design changes that a survey asking residents to rate their safety would not have located.
Conclusion
Participatory mapping and visual methods let communities show what they know about their own places and lives. They draw on knowledge that is hard to verbalise, support discussion and analysis within groups, and shift some control over research to participants. They require care over power, interpretation and consent, but used well they produce knowledge that is both locally grounded and visible to decision-makers.
References
Catalani, C., & Minkler, M. (2010). Photovoice: A review of the literature in health and public health. Health Education & Behavior, 37(3), 424–451. https://doi.org/10.1177/1090198109342084
Chambers, R. (1994). The origins and practice of participatory rural appraisal. World Development, 22(7), 953–969. https://doi.org/10.1016/0305-750X(94)90141-4
Chambers, R. (2006). Participatory mapping and geographic information systems: Whose map? Who is empowered and who disempowered? Who gains and who loses? Electronic Journal of Information Systems in Developing Countries, 25(1), 1–11. https://doi.org/10.1002/j.1681-4835.2006.tb00163.x
Cornwall, A., & Jewkes, R. (1995). What is participatory research? Social Science & Medicine, 41(12), 1667–1676. https://doi.org/10.1016/0277-9536(95)00127-S
Guillemin, M., & Drew, S. (2010). Questions of process in participant-generated visual methodologies. Visual Studies, 25(2), 175–188. https://doi.org/10.1080/1472586X.2010.502676
Harper, D. (2002). Talking about pictures: A case for photo elicitation. Visual Studies, 17(1), 13–26. https://doi.org/10.1080/14725860220137345
Kesby, M. (2000). Participatory diagramming: Deploying qualitative methods through an action research epistemology. Area, 32(4), 423–435. https://doi.org/10.1111/j.1475-4762.2000.tb00158.x
Rambaldi, G., Kwaku Kyem, P. A., McCall, M., & Weiner, D. (2006). Participatory spatial information management and communication in developing countries. Electronic Journal of Information Systems in Developing Countries, 25(1), 1–9. https://doi.org/10.1002/j.1681-4835.2006.tb00162.x
Rose, G. (2016). Visual methodologies: An introduction to researching with visual materials (4th ed.). SAGE.
Wang, C., & Burris, M. A. (1997). Photovoice: Concept, methodology, and use for participatory needs assessment. Health Education & Behavior, 24(3), 369–387. https://doi.org/10.1177/109019819702400309