
Research · Market and business research
Market Research: Scope, Methods and Value to Business
What market research covers, the main methods it uses, how large the industry is, and what the evidence shows about its value to the businesses that use it.
Every business decision rests on assumptions about customers, competitors and the market. Market research is the organised effort to test those assumptions before money is committed. Malhotra (2019) defines marketing research as the systematic and objective identification, collection, analysis, dissemination and use of information to improve decisions about marketing problems and opportunities. The key words are systematic and use: research is planned in advance, and it exists to inform a decision, not to fill a report. This article sets out what market research covers, the main methods it uses, the size of the industry, and the evidence on what it is worth to the firms that use it.
Market research and marketing research
The two terms are often used interchangeably. Where a distinction is drawn, market research refers to the study of a market itself: its size, growth, structure, customers and competitors. Marketing research is broader and includes research on the firm's own marketing activities, such as testing an advertisement, a price or a package design. In practice most research suppliers and most textbooks use both labels for the same body of work, and this article does the same.
Scope: the questions research answers
Malhotra (2019) divides the field into two broad types. Problem-identification research helps managers find problems or opportunities that are not yet obvious. It includes estimates of market size and potential, studies of market share, analysis of trends, forecasting and brand image tracking. Problem-solving research helps managers choose between courses of action once a problem is known. It includes research on segmentation, product design, pricing, promotion and distribution.
Typical questions in each area include:
- Market size and growth: How many potential buyers are there, how much do they spend, and is the category expanding or shrinking?
- Segmentation: Which groups of customers have different needs and respond differently to marketing? Smith (1956) described segmentation as a strategy of adjusting products and marketing to the differing requirements of distinct groups of buyers, rather than treating the market as one.
- Product and concept testing: Which features matter most, and which version of a new product is preferred?
- Pricing: How sensitive is demand to price, and how do customers trade price against features?
- Advertising and communication: Does a campaign reach the intended audience, and does it change awareness or attitudes?
- Customer satisfaction and loyalty: How do existing customers rate the product and service, and what drives them to stay or leave?
- Competitive intelligence: What are competitors offering, at what price, and how are they positioned?
The research process
Most textbooks describe a similar sequence of steps. Malhotra (2019) sets out six: defining the problem, developing an approach, formulating the research design, doing fieldwork or collecting data, preparing and analysing the data, and preparing and presenting the report.
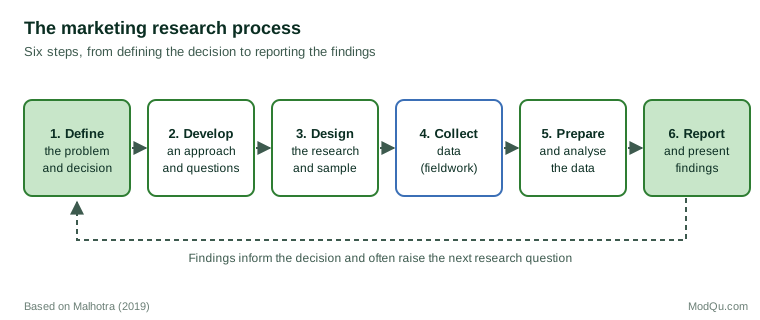
The first step is the one most often rushed. A request such as "find out why sales are down" is a symptom, not a research problem. A useful problem statement names the decision the research will inform (for example, whether to cut the price or relaunch the product), the information needed to make it, and the population to be studied. A clear statement also sets the budget: research is worth commissioning only when the cost of a wrong decision is larger than the cost of the study.
Methods
Exploratory, descriptive and causal designs. Malhotra (2019) groups research designs by purpose. Exploratory research builds understanding when little is known, often through interviews, focus groups or a review of existing information. Descriptive research measures characteristics of a market, such as the share of customers who use a product or their average spending, usually through surveys or analysis of sales data. Causal research tests whether one variable affects another, normally through experiments.
Primary and secondary data. Primary data are collected for the study at hand; secondary data were collected by someone else for another purpose, such as government statistics, industry reports or the firm's own sales records (Hox & Boeije, 2005). Secondary data are cheaper and faster, so good practice is to search them first and collect new data only to fill the gaps.
Qualitative and quantitative methods. Qualitative methods, such as in-depth interviews, focus groups and ethnography, explore how people think and behave in their own terms. Arnould and Wallendorf (1994) showed how ethnographic observation of consumers in natural settings can inform marketing strategy. Quantitative methods, such as surveys and analysis of transaction data, measure how common a view or behaviour is and how variables relate across a population.
Experiments. Experiments are the most direct way to establish cause and effect. Online, firms routinely run controlled experiments, often called A/B tests, in which users are randomly shown different versions of a page or offer and their behaviour is compared (Kohavi et al., 2020). Random assignment means that a difference in outcomes can be attributed to the change being tested.
Conjoint analysis. Conjoint analysis asks respondents to choose between or rate product profiles that combine different features and prices. From their choices, analysts estimate how much each feature contributes to preference. Green and Srinivasan (1990) reviewed its development and its wide commercial use in product design and pricing.
Designed and organic data. Groves (2011) distinguished "designed" data, such as surveys built to answer a question, from "organic" data that are produced as a by-product of digital systems, such as transaction records and web activity. Organic data are cheap and plentiful but were not created for research, so their meaning is often unclear without context. Groves argued that the greatest value lies in combining the two.
The size of the industry
ESOMAR, the global association for market and social research, publishes annual estimates of the insights industry. Its Global Market Research 2025 report estimated that the wider industry, which includes research software, reporting and analytics as well as traditional research, surpassed US$150 billion in 2024. Of this, the market research sector accounted for US$56 billion and grew by 4.8% in 2024, while research software grew by 11.5% (Ajaluni, 2025). The previous year's report put the market research sector at US$54 billion for 2023 (Palacio, 2024).
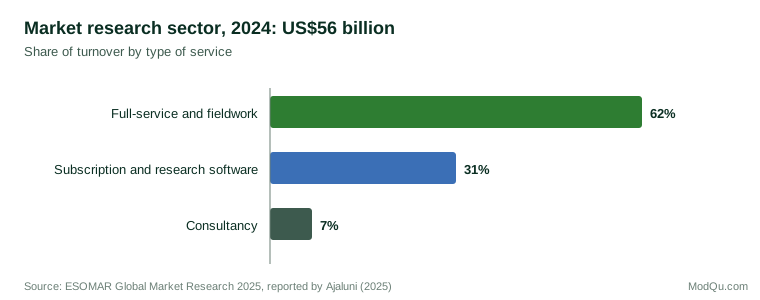
Within the market research sector, about 62% of turnover came from full-service research and fieldwork, 31% from firms providing subscription-based and research software services, and 7% from consultancy (Ajaluni, 2025). The figures show an industry in which traditional project work still dominates but technology-based services are growing faster.
The value of research to business
The strongest evidence for the value of market research comes from studies of market orientation. Kohli and Jaworski (1990) defined market orientation as the organisation-wide generation of market intelligence about current and future customer needs, the dissemination of that intelligence across departments, and the organisation's responsiveness to it. Research is the main source of the intelligence in the first part of this definition.
Narver and Slater (1990) found a substantial positive relationship between market orientation and profitability in a sample of business units of a large corporation. Later studies tested the link in many industries and countries. Kirca et al. (2005) combined the results in a meta-analysis and found a positive average correlation between market orientation and organisational performance of about .32, a moderate effect. Correlation does not prove that research causes better performance, but the pattern is consistent across many studies.
Research produces value only if managers use it. Deshpandé and Zaltman (1982) studied what made managers use market research and found that the technical quality of the research, its actionability, the degree to which findings were surprising, the interaction between researchers and managers, and the structure of the organisation all played a part. Moorman et al. (1992) found that trust between research users and research providers affected how much the research was used. The practical lesson is that research is most useful when managers are involved from the start, when the study is designed around a real decision, and when the findings are presented in terms the decision-maker can act on.
Limits and common failures
Market research reduces uncertainty; it does not remove it. Several failures recur:
- The wrong question. A precise answer to a poorly defined problem is of little use.
- Unrepresentative samples. Results from a convenient group of respondents may not apply to the market as a whole. Survey error arises from coverage, sampling, non-response and measurement, and each needs to be considered in the design (Groves et al., 2009).
- Stated versus actual behaviour. What people say they will do in a survey often differs from what they do. Morwitz et al. (2007) found that purchase intentions predicted sales better for existing products than for new ones, and better over short time horizons than long ones.
- Confirmation-seeking. Research commissioned to support a decision already made tends to be designed, read and reported selectively.
- Over-reliance on one method. Combining several sources, such as a survey with sales data or an experiment, gives a more reliable picture than any single study.
Practical guidance
For a business considering research, a few steps cover most of the value:
- Write down the decision the research will inform and what would change depending on the answer.
- Start with secondary sources, including the firm's own customer and sales data.
- Match the method to the question: qualitative methods to explore, surveys to measure, experiments to test cause and effect.
- Agree the analysis plan and decision criteria before fieldwork begins.
- Involve the people who will act on the findings throughout the project.
Handled in this way, market research is a disciplined means of learning about customers and markets before committing resources, and of checking afterwards whether the decision worked.
References
Ajaluni, L. (2025, November 4). Inside the $153bn insights industry. Research World. https://researchworld.com/articles/inside-the-153bn-insights-industry
Arnould, E. J., & Wallendorf, M. (1994). Market-oriented ethnography: Interpretation building and marketing strategy formulation. Journal of Marketing Research, 31(4), 484–504. https://doi.org/10.1177/002224379403100404
Deshpandé, R., & Zaltman, G. (1982). Factors affecting the use of market research information: A path analysis. Journal of Marketing Research, 19(1), 14–31. https://doi.org/10.2307/3151527
Green, P. E., & Srinivasan, V. (1990). Conjoint analysis in marketing: New developments with implications for research and practice. Journal of Marketing, 54(4), 3–19.
Groves, R. M. (2011). Three eras of survey research. Public Opinion Quarterly, 75(5), 861–871. https://doi.org/10.1093/poq/nfr057
Groves, R. M., Fowler, F. J., Jr., Couper, M. P., Lepkowski, J. M., Singer, E., & Tourangeau, R. (2009). Survey methodology (2nd ed.). Wiley.
Hox, J. J., & Boeije, H. R. (2005). Data collection, primary vs. secondary. In K. Kempf-Leonard (Ed.), Encyclopedia of social measurement (pp. 593–599). Academic Press.
Kirca, A. H., Jayachandran, S., & Bearden, W. O. (2005). Market orientation: A meta-analytic review and assessment of its antecedents and impact on performance. Journal of Marketing, 69(2), 24–41.
Kohavi, R., Tang, D., & Xu, Y. (2020). Trustworthy online controlled experiments: A practical guide to A/B testing. Cambridge University Press. https://doi.org/10.1017/9781108653985
Kohli, A. K., & Jaworski, B. J. (1990). Market orientation: The construct, research propositions, and managerial implications. Journal of Marketing, 54(2), 1–18. https://doi.org/10.1177/002224299005400201
Malhotra, N. K. (2019). Marketing research: An applied orientation (7th ed., global ed.). Pearson.
Moorman, C., Zaltman, G., & Deshpandé, R. (1992). Relationships between providers and users of market research: The dynamics of trust within and between organizations. Journal of Marketing Research, 29(3), 314–328.
Morwitz, V. G., Steckel, J. H., & Gupta, A. (2007). When do purchase intentions predict sales? International Journal of Forecasting, 23(3), 347–364.
Narver, J. C., & Slater, S. F. (1990). The effect of a market orientation on business profitability. Journal of Marketing, 54(4), 20–35. https://doi.org/10.1177/002224299005400403
Palacio, X. (2024, November 20). Drivers of our $142bn insights industry. Research World. https://researchworld.com/articles/drivers-of-our-142bn-insights-industry
Smith, W. R. (1956). Product differentiation and market segmentation as alternative marketing strategies. Journal of Marketing, 21(1), 3–8.