
Research · Quantitative and mixed methods
Computational Social Science Methods for Large-Scale Knowledge Discovery
What computational social science is and how its main methods work, covering digital trace data, text as data, word embeddings, network analysis, online experiments, simulation and machine learning, with the methodological cautions each requires.
Social science has traditionally relied on surveys, interviews, experiments in laboratories and official statistics. Over the past two decades, a new set of methods has grown up around the digital records people leave and the computing power available to analyse them. Computational social science uses these data and methods to study human behaviour and social systems at a scale and level of detail that was previously impossible. Lazer et al. (2009) announced the field in an influential article, arguing that the capacity to collect and analyse data with unprecedented breadth, depth and scale was transforming the study of society. This article describes the main methods, what they have revealed and the cautions they require.
What is computational social science?
Edelmann et al. (2020) described computational social science as the use of digital data and computational methods to study social life, and identified two broad strands. The first uses new sources of data, such as social media, digitised texts and mobile phone records, to measure behaviour. The second uses computational methods, such as machine learning, network analysis and simulation, to analyse data or model social processes. Many projects combine both.
Watts (2007) argued that the social sciences had long been limited by the difficulty of observing interactions among large numbers of people over time, and that digital communication technologies were removing that limit. He suggested that this could make the twenty-first century a period of rapid progress in understanding collective social phenomena, much as new instruments had transformed the natural sciences.
Salganik (2018) cautioned against seeing the field as a replacement for older methods. He argued that the most productive work combines the strengths of digital data, such as scale and continuous measurement, with the strengths of traditional social research, such as careful design and attention to representativeness and meaning.
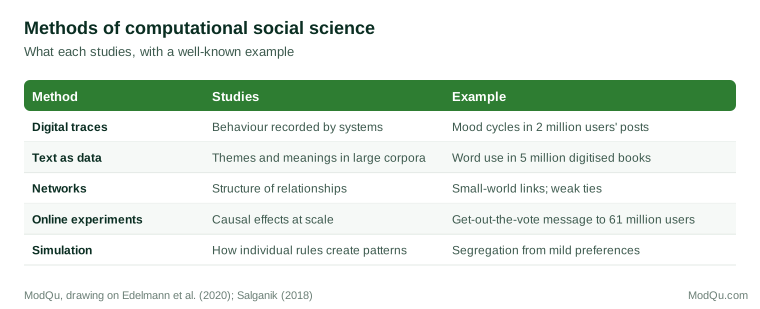
The main families of methods are summarised below.
Digital trace data
Digital traces are records of behaviour generated as a by-product of using digital systems: posts, searches, clicks, purchases, location data. They allow researchers to observe what people do rather than what they say they do, often continuously and for very large populations.
Golder and Macy (2011) analysed messages from about two million Twitter users across 84 countries to study daily and seasonal patterns in mood. They found that positive mood peaked in the morning and again near midnight, and that patterns were similar across cultures, consistent with the influence of sleep and circadian rhythms. Such a study would have been impractical with surveys, which cannot easily measure mood hour by hour across millions of people.
Digital traces have well-known limitations. They rarely represent the general population, they reflect the design of the platforms that produce them, and they change as platforms change. Salganik (2018) emphasised that researchers must understand how the data were generated before drawing conclusions.
Text as data
Much of human knowledge and communication is recorded in text. Computational text analysis treats large collections of documents as data. Grimmer and Stewart (2013) reviewed methods for political texts and set out four principles: all quantitative models of language are wrong but some are useful; automated methods augment but do not replace careful reading; there is no single best method; and every method must be validated for the task at hand.
Topic models, such as latent Dirichlet allocation (Blei et al., 2003), identify clusters of words that tend to appear together across documents, which researchers interpret as topics. They allow researchers to map the themes in thousands or millions of documents and track how they change.
Michel et al. (2011) analysed a corpus of more than five million digitised books, about 4 percent of all books ever printed, to track the frequency of words and phrases over two centuries. They called the approach culturomics and used it to study the adoption of new technologies, changes in grammar, the rise and fall of fame and the effects of censorship.
Evans and Aceves (2016) reviewed how text mining can contribute to social theory, describing how computational analysis can reveal patterns in the meaning of texts, the social contexts that produced them and the relationships between texts and social outcomes. Nelson (2020) proposed computational grounded theory, a framework that combines computational pattern detection with close reading and interpretation, so that machine analysis guides human attention and human interpretation validates machine results.
Word embeddings
Word embeddings represent each word as a point in a space of many dimensions, positioned so that words used in similar contexts lie close together. Relationships between words can then be measured as distances and directions. Garg et al. (2018) used embeddings trained on a century of American texts to measure associations between gender and occupations, and between ethnic groups and descriptive adjectives. The changes they found tracked historical shifts in women's employment and in attitudes toward ethnic groups, suggesting that embeddings can serve as a record of cultural change. Kozlowski et al. (2019) used embeddings of millions of books to study how the meanings of social class, such as associations with wealth, education and cultivation, changed over the twentieth century.
Embeddings capture associations present in the texts they are trained on, including biases. This makes them useful for measuring cultural associations, but risky when they are built into systems that make decisions about people.
Network analysis
Social life consists of relationships, and network analysis studies their structure. Granovetter (1973) argued that weak ties, such as acquaintances, are especially important for spreading information, because they connect otherwise separate social circles. Watts and Strogatz (1998) showed that networks in which most connections are local can still have short paths between any two members if a few connections link distant parts, a property they called small-world structure. Barabási and Albert (1999) showed that many real networks have a few very highly connected hubs, which can arise when new members preferentially connect to those who are already well connected.
Digital data have made it possible to study networks with millions of members. Researchers can map how information, behaviours and opinions spread through networks, identify influential positions and study how network structure shapes outcomes.
Online experiments
Digital platforms make experiments possible at very large scale. Bond et al. (2012) conducted an experiment with 61 million Facebook users during the 2010 United States congressional elections. Users who were shown a message encouraging them to vote, together with pictures of friends who had already voted, were slightly more likely to vote than those shown the message alone. The effect on each person was small, but because it spread through social ties and was multiplied across millions of users, the authors estimated that it increased turnout by several hundred thousand votes.
Salganik et al. (2006) created an artificial music market online, in which about 14,000 participants listened to and downloaded songs by unknown bands. Participants were randomly assigned to independent "worlds". In some, they could see how many times others had downloaded each song. Social influence made success both more unequal and more unpredictable: the same songs succeeded in some worlds and failed in others. The experiment showed how difficult it can be to predict which products or ideas will succeed, even with perfect information about their quality.
Simulation
Not all computational social science uses data. Agent-based models simulate the behaviour of many individual agents following simple rules, and observe the patterns that emerge. Schelling (1971) showed, using simple models that could be run by hand, that strong residential segregation could arise even when every individual was content to live in a mixed neighbourhood but preferred not to be in a small minority. The result showed that collective outcomes can differ sharply from individual intentions, a theme central to computational social science.
Prediction and explanation
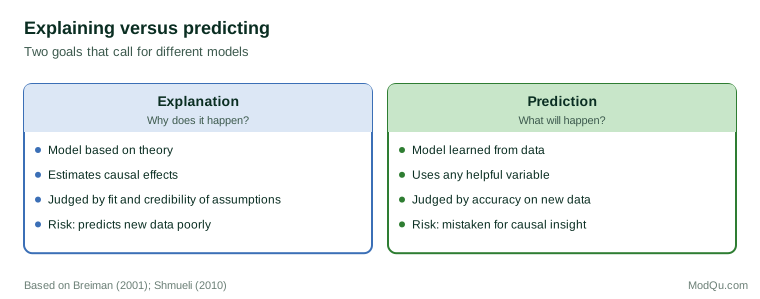
Machine learning has brought a new emphasis on prediction to the social sciences. Breiman (2001) described two cultures of statistical modelling: one that assumes a model of how data were generated and estimates its parameters, and one that treats the process as unknown and seeks the most accurate predictions. Mullainathan and Spiess (2017) explained how machine learning can help applied economists, while warning that predictive models are not designed to estimate causal effects, and that the variables a model relies on may change from one sample to another without any change in predictive accuracy.
Shmueli (2010) clarified that explanation and prediction are different goals. Hofman et al. (2017) argued that social science would benefit from taking prediction more seriously, by testing explanatory models on data not used to build them, and from being clearer about the limits of prediction in complex social systems. The comparison below summarises the two approaches.
Knowledge discovery and its limits
The phrase "knowledge discovery" suggests that patterns in large datasets reveal new knowledge directly. The examples in this article show a more nuanced picture. Michel et al. (2011) and Garg et al. (2018) did discover patterns that no one had measured before, but the patterns became knowledge only when they were interpreted against historical evidence about technology, censorship, employment and attitudes. Golder and Macy (2011) found a daily rhythm in mood, but explaining it required existing knowledge about sleep and circadian biology.
Computational methods also reveal limits to what can be known. The artificial music market of Salganik et al. (2006) showed that when people influence each other, outcomes depend partly on chance early events, so that even complete information about products cannot predict which will succeed. Hofman et al. (2017) drew a broader lesson: some social outcomes may be inherently hard to predict, and researchers should measure and report how predictable they are rather than assume that more data will eventually make them predictable. Knowing the limits of prediction is itself a form of knowledge.
Combining computational and traditional methods
The strongest computational studies rarely rely on computation alone. Nelson (2020) showed how computational pattern detection can be followed by close reading of selected texts, so that the researcher understands what the patterns mean, and then by further computation to test whether interpretations hold across the whole corpus. Salganik (2018) described ways of linking surveys with digital traces, so that the survey measures attitudes and characteristics that traces miss, while the traces measure behaviour in detail. Interviews can explain why a network has the shape it has; experiments can test whether a pattern found in observational data is causal. Edelmann et al. (2020) observed that some of the most influential work in computational sociology has come from researchers who combined new data with established theories and questions, rather than from data-driven searches for patterns.
Carrying out a computational project
A computational project usually moves through several stages:
- Frame the question. Decide what social process or concept is of interest, and what evidence would answer the question.
- Find or collect data. Identify suitable sources, check terms of use and privacy obligations, and document exactly how data were obtained.
- Understand the data. Explore how the data were generated, who is included and how the source has changed over time.
- Measure. Turn raw data into measures of the concepts of interest, and validate those measures against human judgement or other data.
- Analyse. Apply methods suited to the question, distinguishing exploration from confirmation and prediction from explanation.
- Interpret and check. Relate findings to theory, test them on new data where possible, and consider alternative explanations.
- Share. Make code, and data where permitted, available so that others can reproduce the work.
Each step involves judgement, and the quality of a computational study depends on these judgements as much as on the sophistication of its algorithms.
Skills and openness
Computational social science draws on programming, statistics, machine learning and the substantive knowledge of the social sciences. Lazer et al. (2009) noted that few researchers had all these skills and called for training and collaboration across disciplines. Much of the field's work is done by teams that combine computer scientists with social scientists. Because computational analyses involve many steps, sharing code is especially important: it allows others to check results, find errors and build on the work. Where data cannot be shared, because they are private or sensitive, researchers can share detailed descriptions, synthetic versions of the data or access arrangements through secure facilities.
Methodological cautions
Computational methods bring their own risks:
- Representativeness. Digital data rarely represent a general population, and findings may apply only to the users of a particular platform.
- Construct validity. Counts of words or clicks may not measure the concepts researchers care about. A "like" may signal approval, irony or politeness.
- Validation. Automated methods must be checked against human judgement and other evidence (Grimmer & Stewart, 2013).
- Reproducibility. Data held by private platforms may be unavailable to other researchers, and platforms change.
- Ethics. Large-scale data and experiments can affect millions of people. The experiments by Bond et al. (2012) and others raised questions about consent and the power of platforms to influence behaviour.
- Theory. Patterns in large datasets do not interpret themselves. Lazer et al. (2009) stressed that the field needs theory as much as data.
Uses for organisations
Organisations can use computational methods to study their customers, employees and markets. Text analysis can summarise thousands of reviews or support tickets; network analysis can map communication and collaboration inside a company; online experiments can test products and messages; simulations can explore how policies might play out. A hypothetical example: a company maps internal email metadata, with appropriate privacy safeguards, and finds that two divisions that must coordinate on product launches have very few direct ties, with communication passing through a handful of managers. Interviews confirm that launches are delayed when those managers are unavailable. The company creates joint working groups, and a follow-up analysis shows more direct ties between the divisions. The network analysis identified the problem; interviews explained it.
Conclusion
Computational social science uses digital data and computational methods to study social life at new scales. Text analysis, word embeddings, network analysis, online experiments, simulation and machine learning have produced findings about mood, culture, influence, inequality and collective behaviour that older methods could not reach. Their value depends on the same foundations as all research: clear questions, valid measures, attention to who is represented, validation, ethical care and theory that turns patterns into understanding.
References
Barabási, A.-L., & Albert, R. (1999). Emergence of scaling in random networks. Science, 286(5439), 509–512. https://doi.org/10.1126/science.286.5439.509
Blei, D. M., Ng, A. Y., & Jordan, M. I. (2003). Latent Dirichlet allocation. Journal of Machine Learning Research, 3, 993–1022.
Bond, R. M., Fariss, C. J., Jones, J. J., Kramer, A. D. I., Marlow, C., Settle, J. E., & Fowler, J. H. (2012). A 61-million-person experiment in social influence and political mobilization. Nature, 489(7415), 295–298. https://doi.org/10.1038/nature11421
Breiman, L. (2001). Statistical modeling: The two cultures. Statistical Science, 16(3), 199–231. https://doi.org/10.1214/ss/1009213726
Edelmann, A., Wolff, T., Montagne, D., & Bail, C. A. (2020). Computational social science and sociology. Annual Review of Sociology, 46, 61–81. https://doi.org/10.1146/annurev-soc-121919-054621
Evans, J. A., & Aceves, P. (2016). Machine translation: Mining text for social theory. Annual Review of Sociology, 42, 21–50. https://doi.org/10.1146/annurev-soc-081715-074206
Garg, N., Schiebinger, L., Jurafsky, D., & Zou, J. (2018). Word embeddings quantify 100 years of gender and ethnic stereotypes. Proceedings of the National Academy of Sciences, 115(16), E3635–E3644. https://doi.org/10.1073/pnas.1720347115
Golder, S. A., & Macy, M. W. (2011). Diurnal and seasonal mood vary with work, sleep, and daylength across diverse cultures. Science, 333(6051), 1878–1881. https://doi.org/10.1126/science.1202775
Granovetter, M. S. (1973). The strength of weak ties. American Journal of Sociology, 78(6), 1360–1380. https://doi.org/10.1086/225469
Grimmer, J., & Stewart, B. M. (2013). Text as data: The promise and pitfalls of automatic content analysis methods for political texts. Political Analysis, 21(3), 267–297. https://doi.org/10.1093/pan/mps028
Hofman, J. M., Sharma, A., & Watts, D. J. (2017). Prediction and explanation in social systems. Science, 355(6324), 486–488. https://doi.org/10.1126/science.aal3856
Kozlowski, A. C., Taddy, M., & Evans, J. A. (2019). The geometry of culture: Analyzing the meanings of class through word embeddings. American Sociological Review, 84(5), 905–949. https://doi.org/10.1177/0003122419877135
Lazer, D., Pentland, A., Adamic, L., Aral, S., Barabási, A.-L., Brewer, D., Christakis, N., Contractor, N., Fowler, J., Gutmann, M., Jebara, T., King, G., Macy, M., Roy, D., & Van Alstyne, M. (2009). Computational social science. Science, 323(5915), 721–723. https://doi.org/10.1126/science.1167742
Michel, J.-B., Shen, Y. K., Aiden, A. P., Veres, A., Gray, M. K., The Google Books Team, Pickett, J. P., Hoiberg, D., Clancy, D., Norvig, P., Orwant, J., Pinker, S., Nowak, M. A., & Aiden, E. L. (2011). Quantitative analysis of culture using millions of digitized books. Science, 331(6014), 176–182. https://doi.org/10.1126/science.1199644
Mullainathan, S., & Spiess, J. (2017). Machine learning: An applied econometric approach. Journal of Economic Perspectives, 31(2), 87–106. https://doi.org/10.1257/jep.31.2.87
Nelson, L. K. (2020). Computational grounded theory: A methodological framework. Sociological Methods & Research, 49(1), 3–42. https://doi.org/10.1177/0049124117729703
Salganik, M. J. (2018). Bit by bit: Social research in the digital age. Princeton University Press.
Salganik, M. J., Dodds, P. S., & Watts, D. J. (2006). Experimental study of inequality and unpredictability in an artificial cultural market. Science, 311(5762), 854–856. https://doi.org/10.1126/science.1121066
Schelling, T. C. (1971). Dynamic models of segregation. Journal of Mathematical Sociology, 1(2), 143–186. https://doi.org/10.1080/0022250X.1971.9989794
Shmueli, G. (2010). To explain or to predict? Statistical Science, 25(3), 289–310. https://doi.org/10.1214/10-STS330
Watts, D. J. (2007). A twenty-first century science. Nature, 445(7127), 489. https://doi.org/10.1038/445489a
Watts, D. J., & Strogatz, S. H. (1998). Collective dynamics of 'small-world' networks. Nature, 393(6684), 440–442. https://doi.org/10.1038/30918